The tutorials part 7 for the Android version of Cargo Surveyor is the second session of the Ullage report tutorial.
Recently we discussed in part the sixth document of the set of documents required to be produced in the load port, the ullage report.
Today we will discuss part 7 of the tutorials, which will deal with the remainder of the ullage report tutorial:
In the previous session concerning the ullage report we discussed how to enter data in the tank editor. We explained the function of the various buttons for changing units, and we discussed briefly the differences between the cargo types that are available. We will now discuss in more detail the use of the bottom line entries L1, L2 and L3 and we will enter all ullages for Testship upon completion of loading the 1st and 2nd parcel of mixed aromatics. After that we will show how to generate the ullage report, send it by mail and export it to csv.
First we will enter all data for the first ullage report. Let’s begin with saving a copy of the ullage report that we created in the last tutorial:
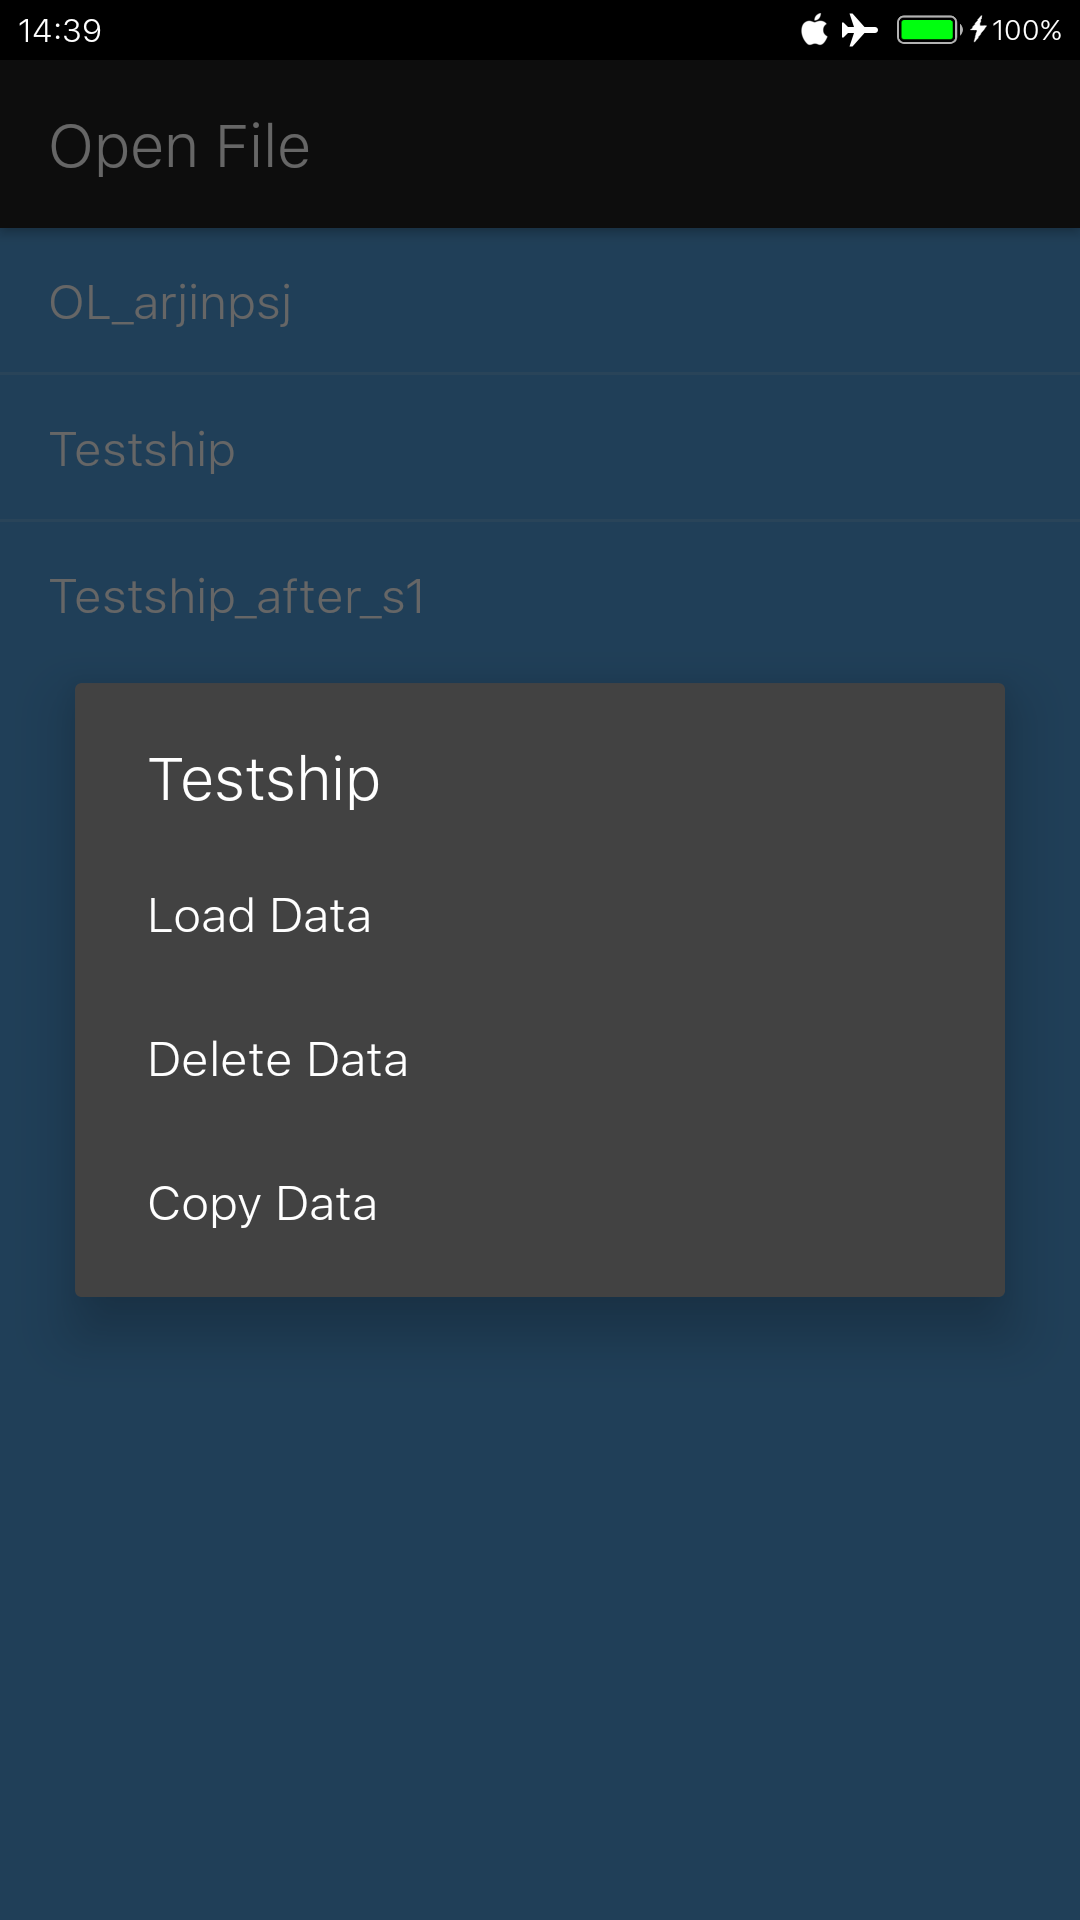
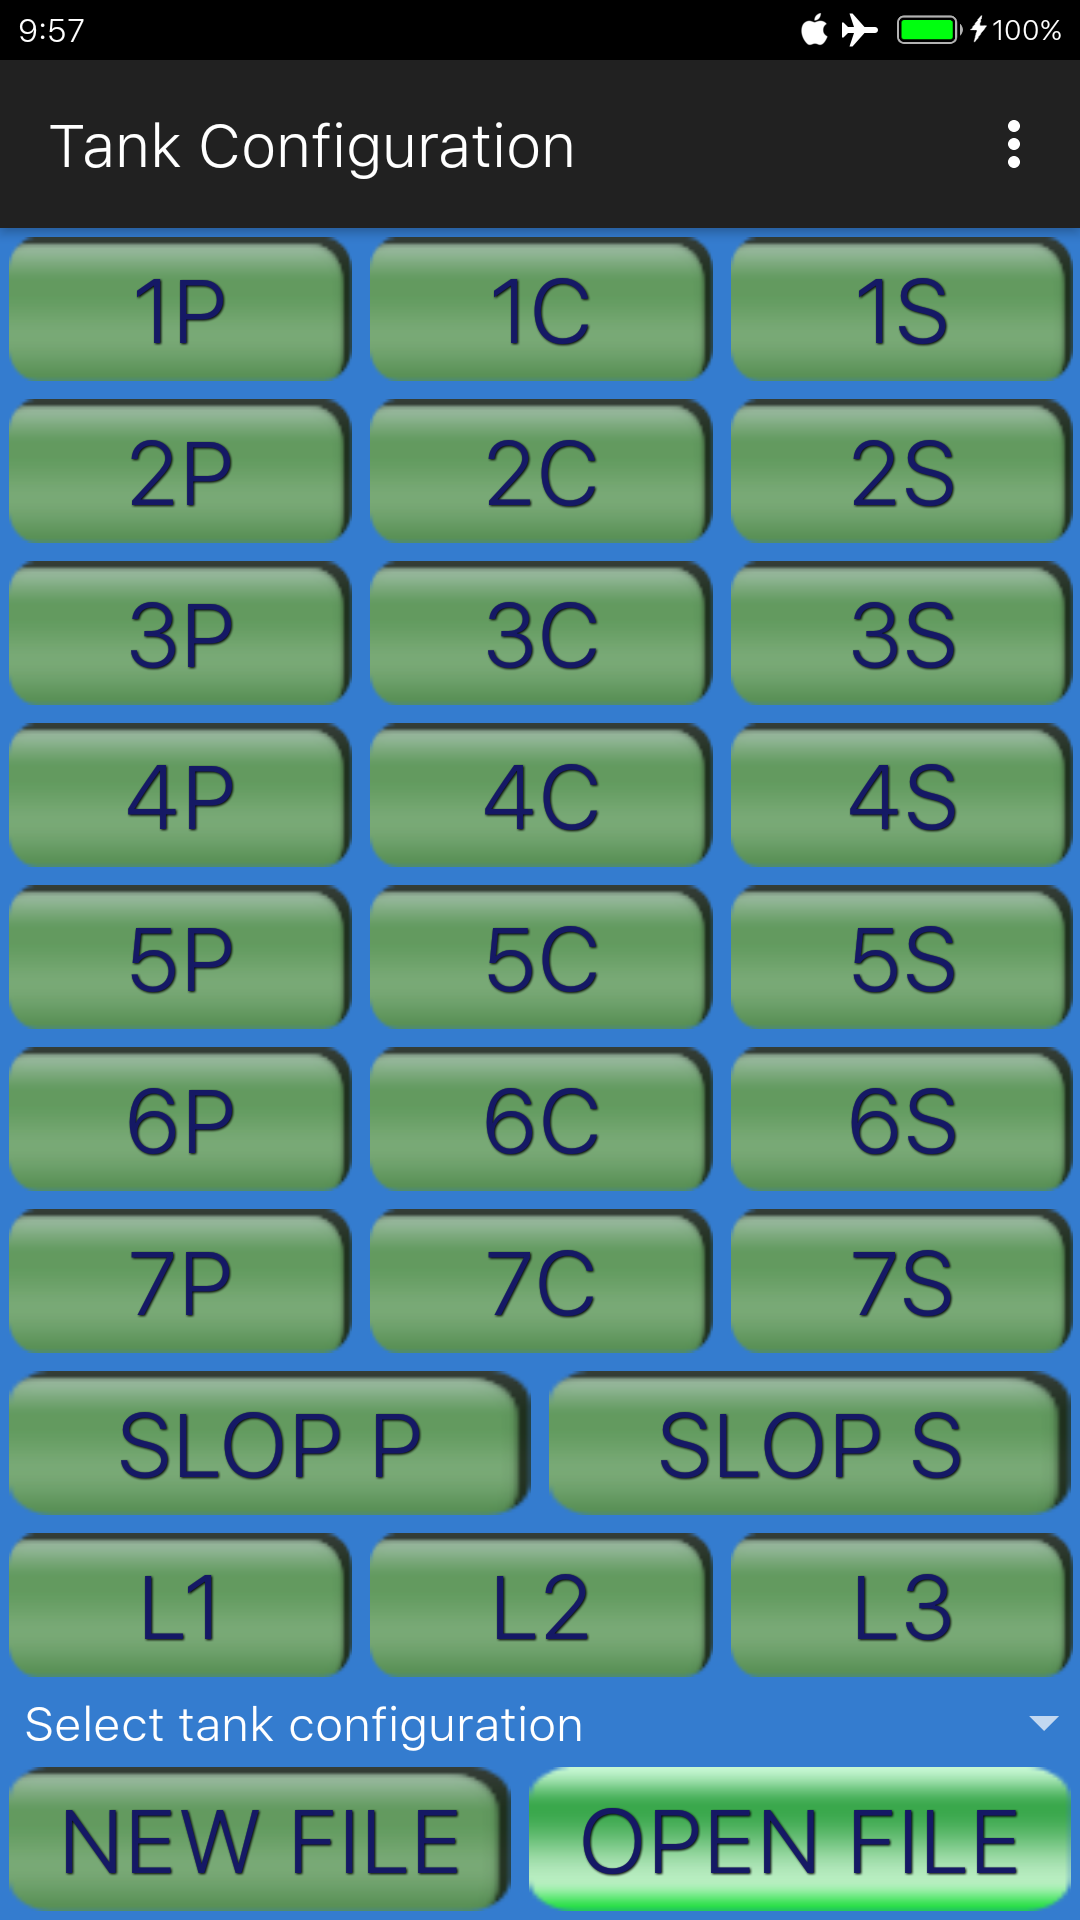
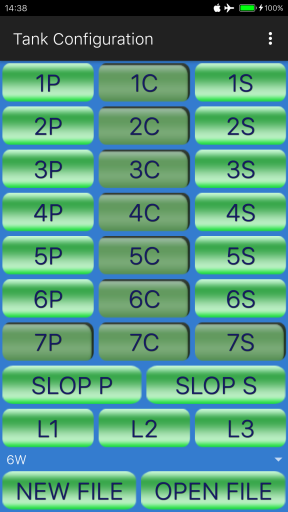
1: From the tank configuration screen, press ‘Open file’ and then press ‘Testship’ in the list of available ullage reports:
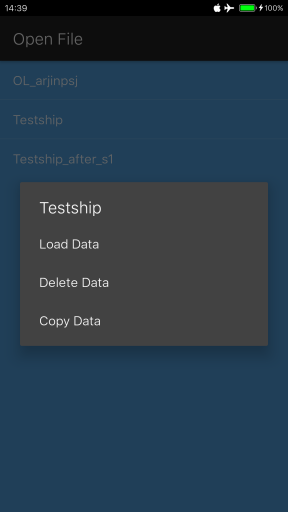
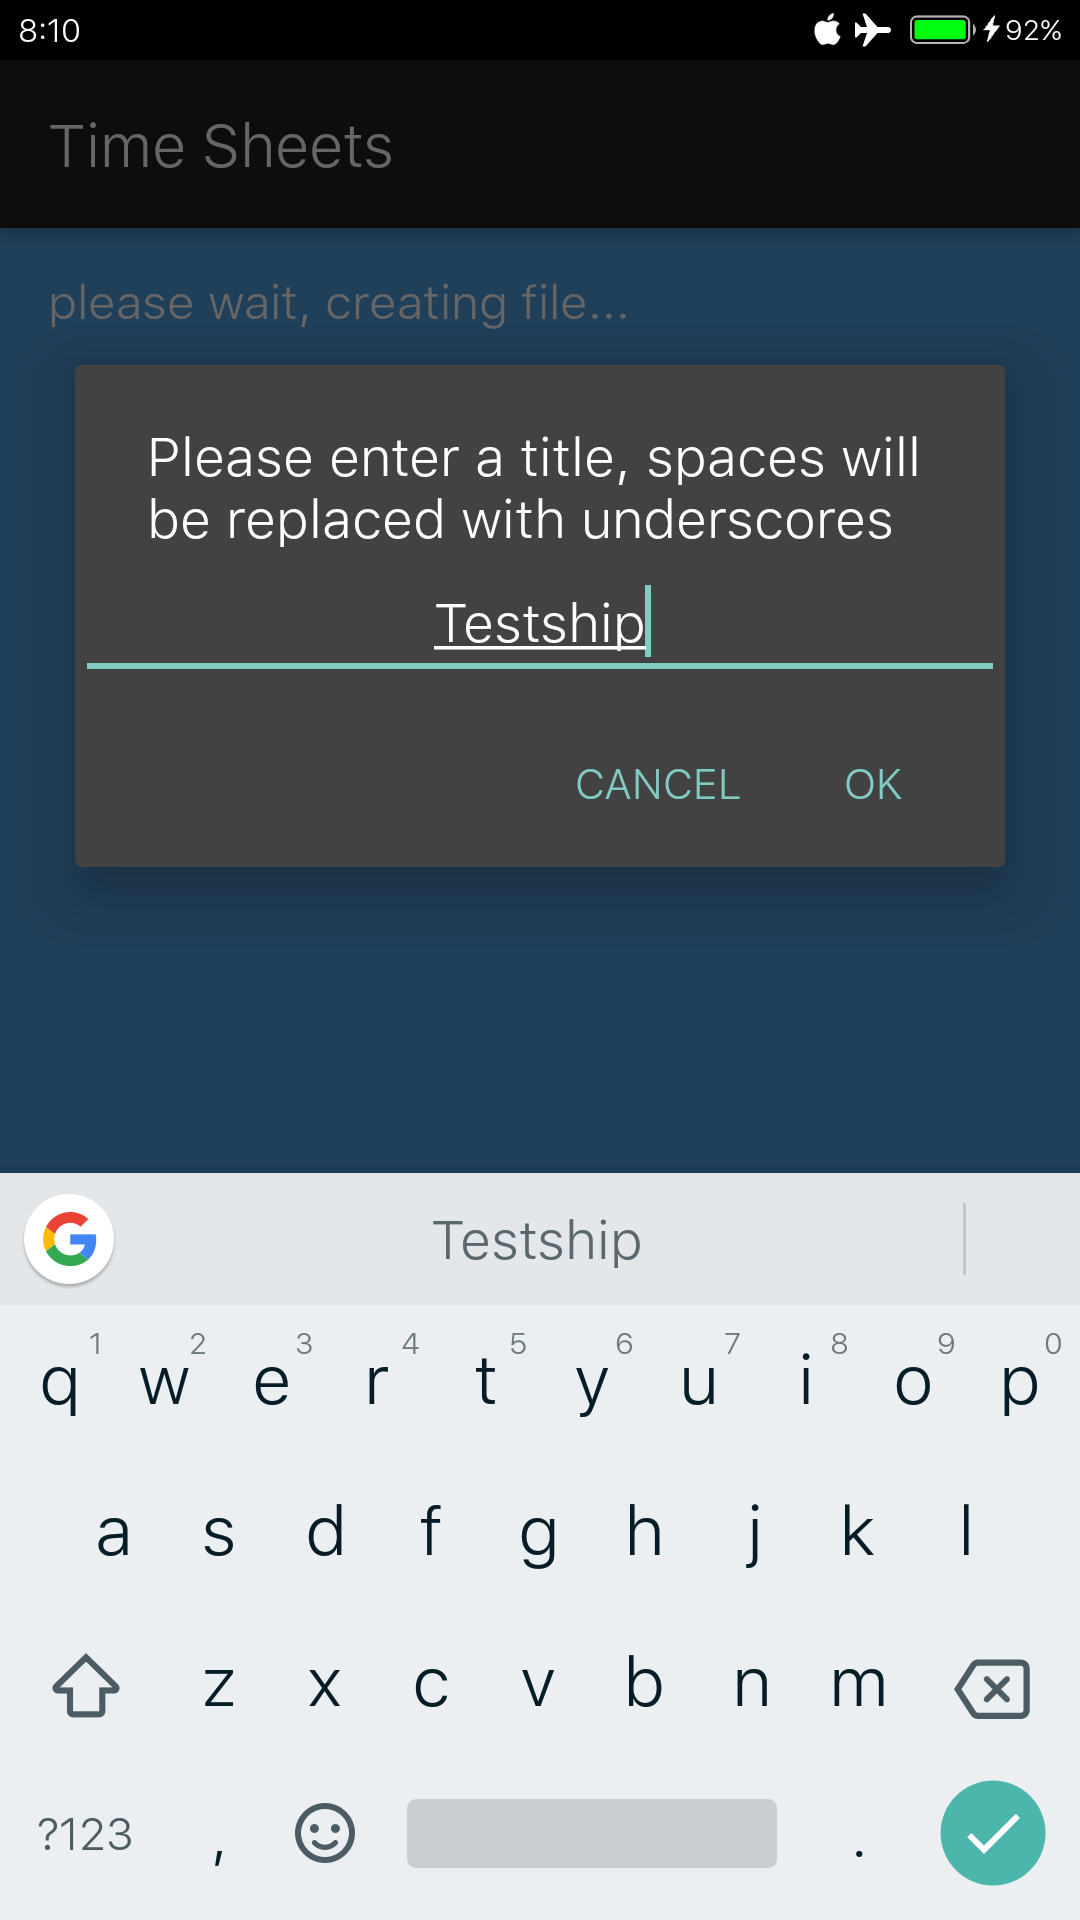
2: Press ‘Copy Data’ instead of ‘Load Data’; a copy of the original report is created, and let’s give the report the title ‘Testship after s1’. Any spaces entered in the file name will automatically be converted to underscores.
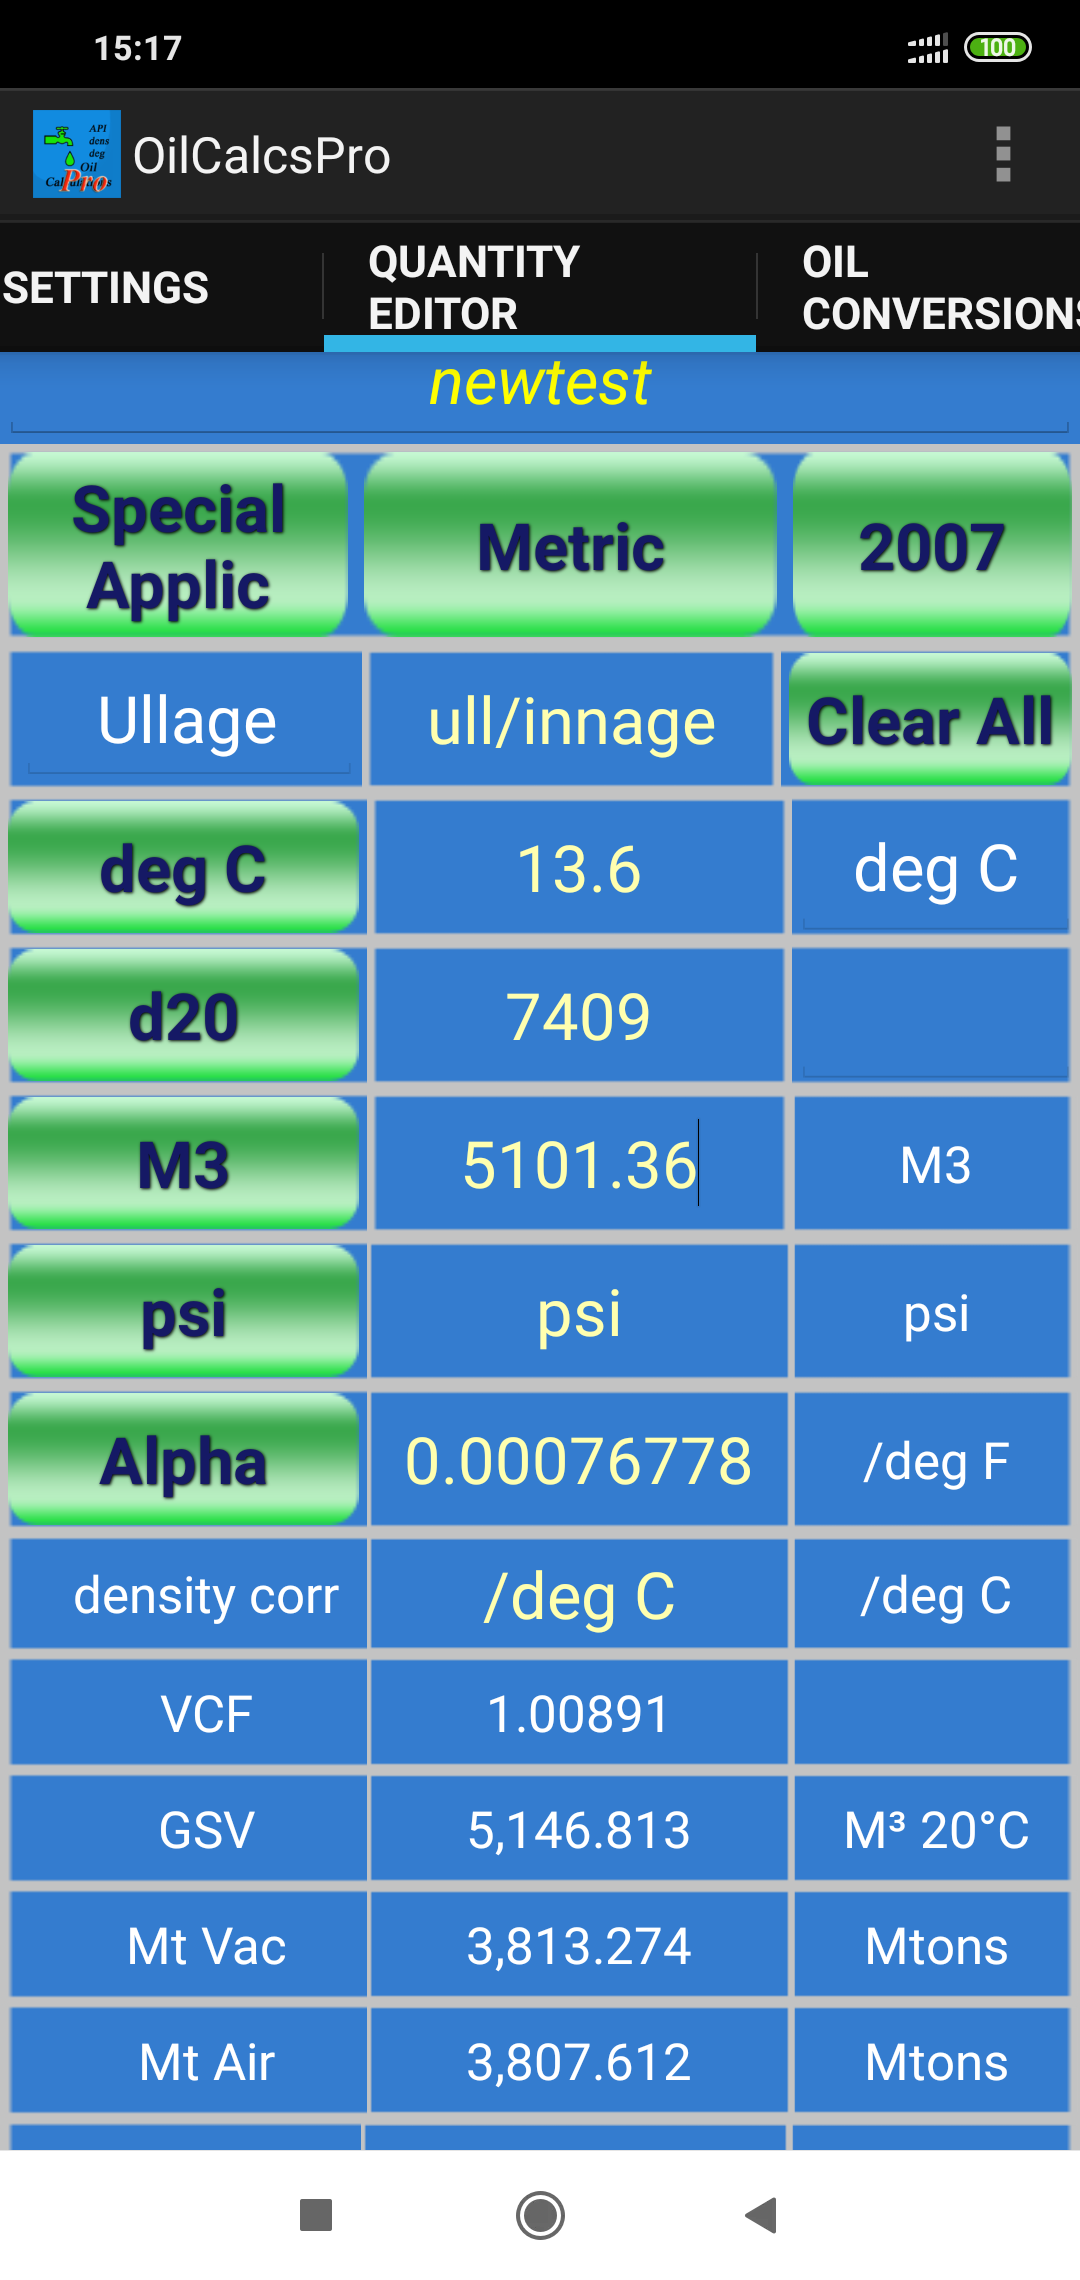
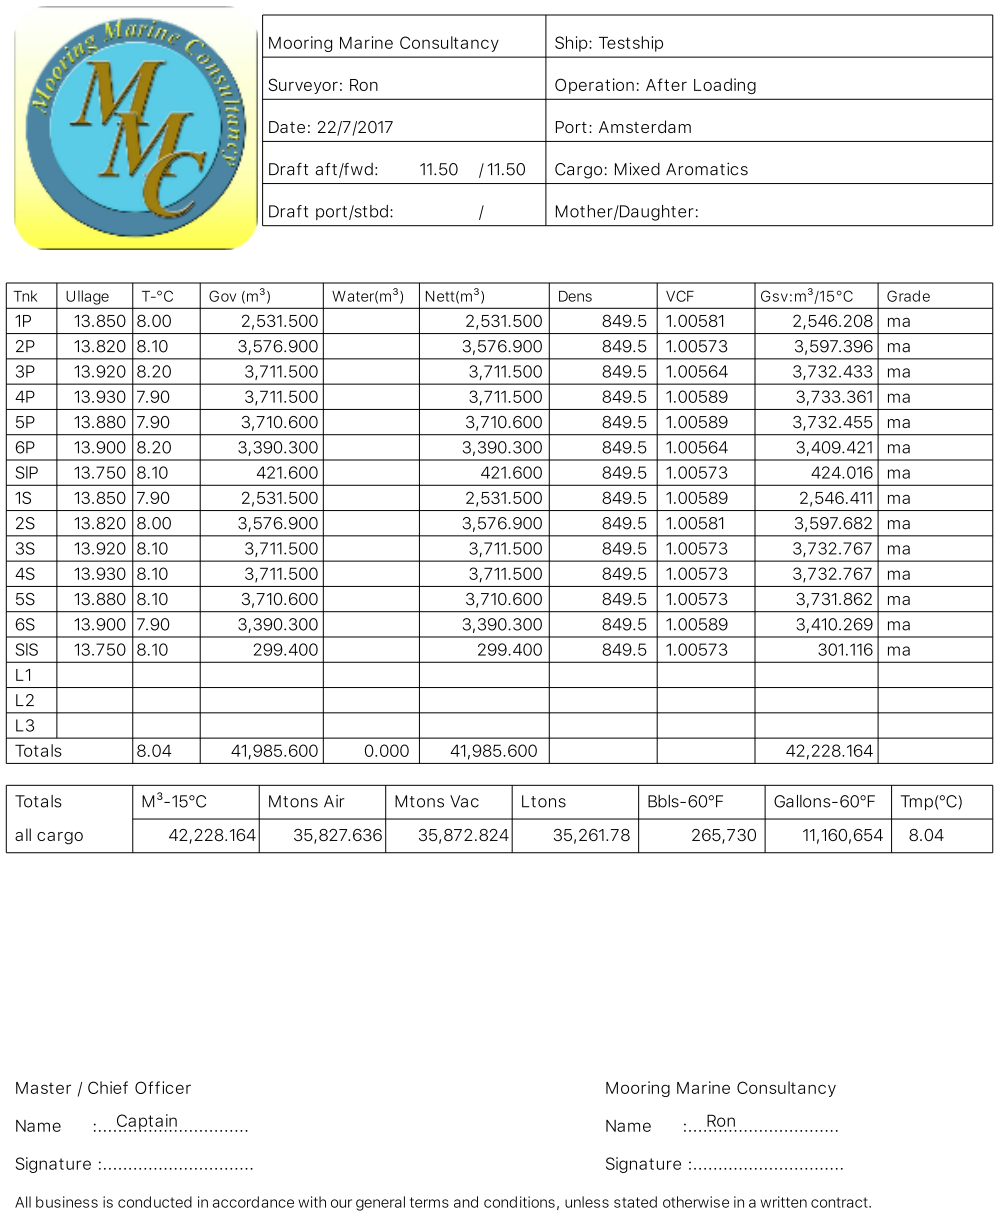
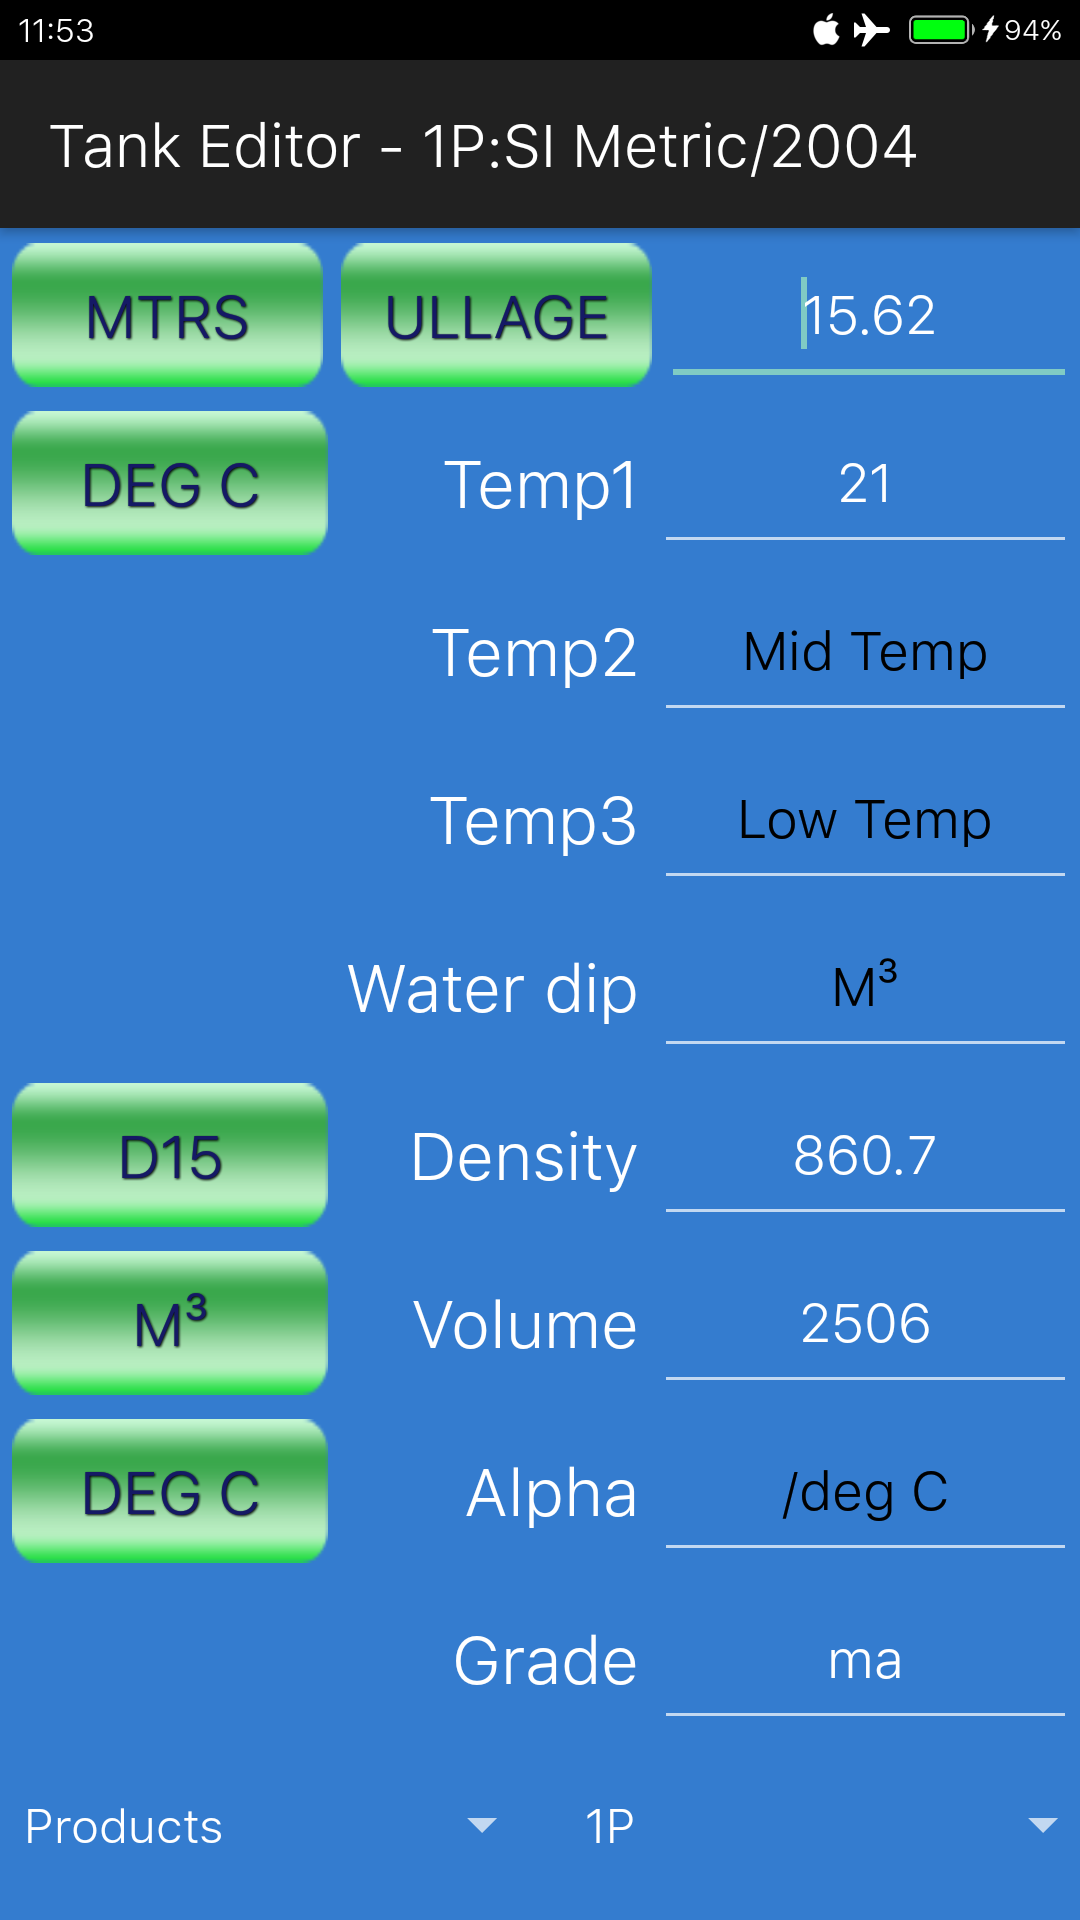
3: Now open ‘Testship_after_s1’ and fill in all the required data as shown below in the ullage report:

The density of the first parcel was 860.7 in vacuum, at 15 deg C, as supplied by the terminal. As discussed in one of the earlier tutorials, we are using ASTM tables 2004 version, with SI Metric settings.
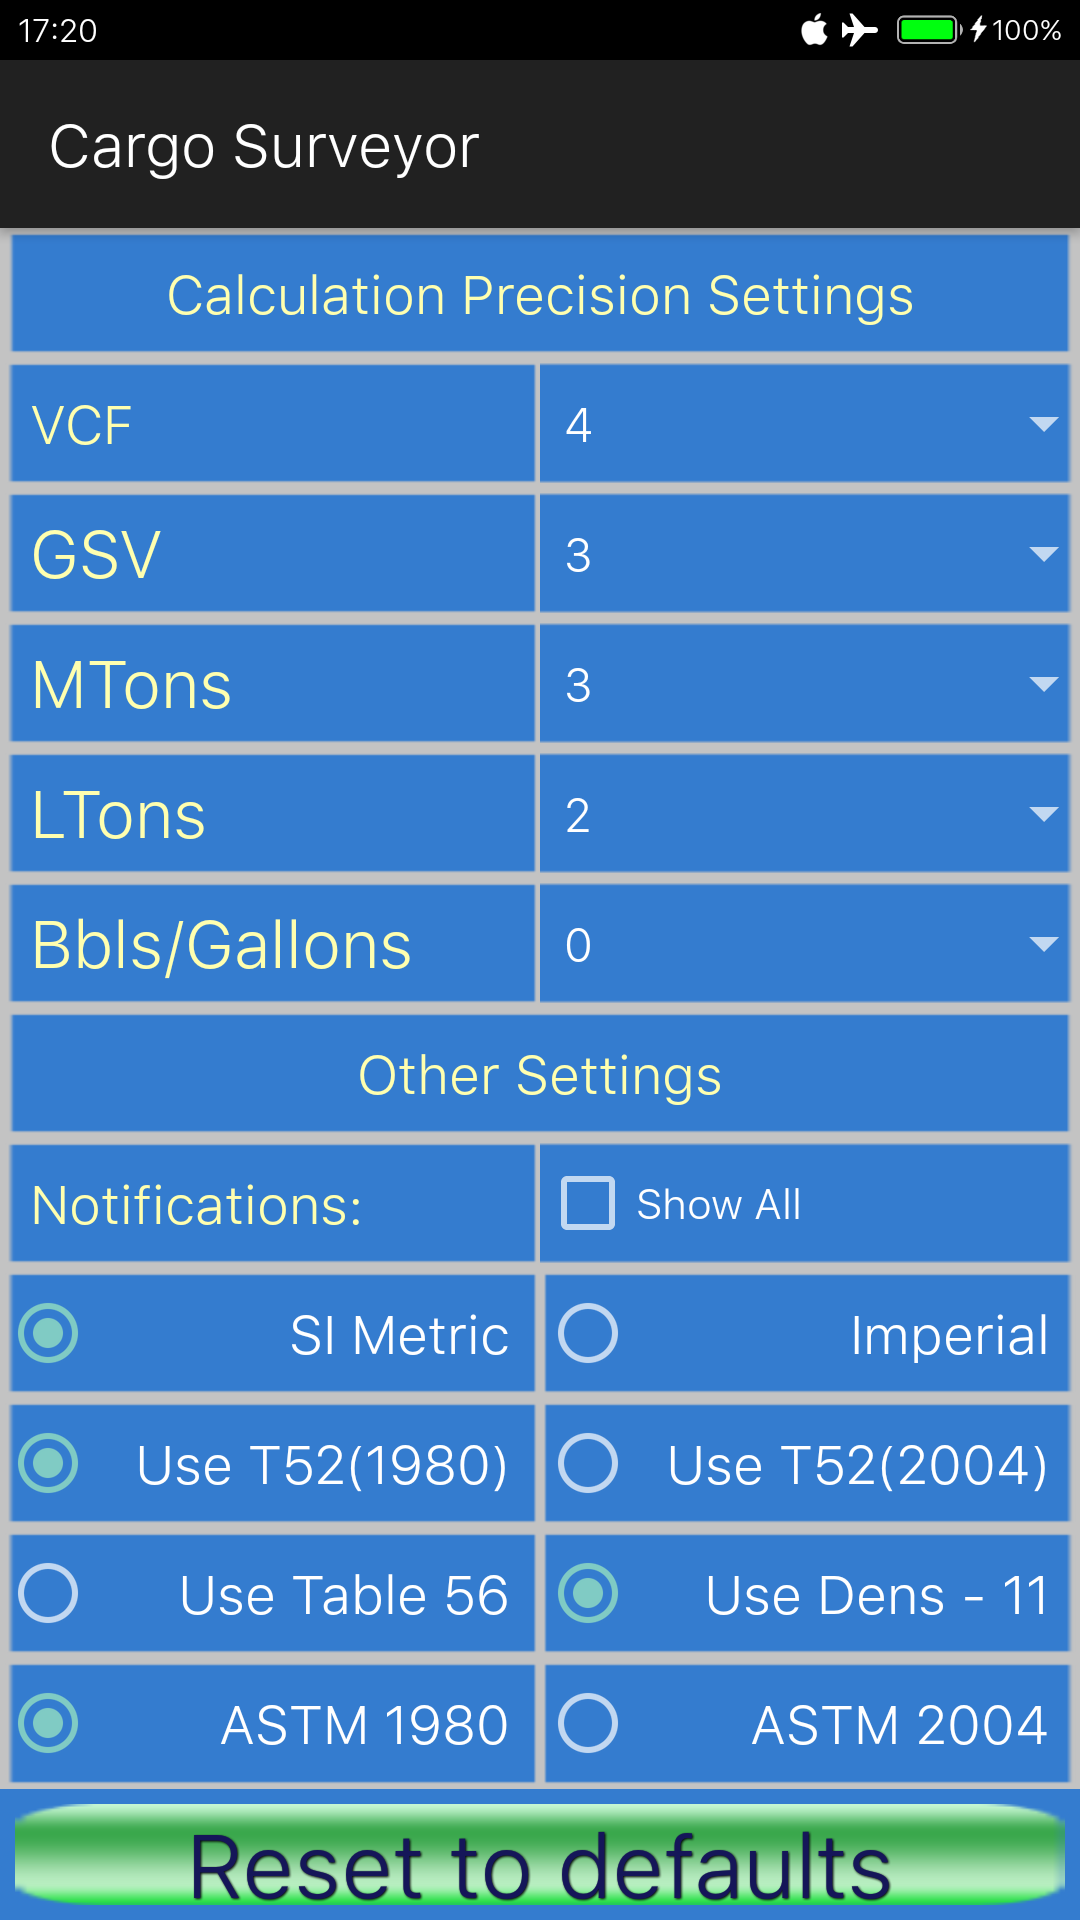
If you do not get exactly the same figures as in the above report, the complete settings as used for our Testship are as follows:

You will have noticed that there are no entries for L1, L2 and L3; this vessel is fitted with deepwell pumps, and consequently has no bottom lines, so no quantities need to be added or deducted for bottom lines.
The use of bottom line entries is mostly applicable to VLCCs and SUEZ max vessels, where bottom line quantities tend to be big (around 300 M³ or more), and also to smaller size conventional tankers that are not fitted with deepwell pumps. Regardless of whether bottom lines are included in tank calibration tables or not, if the vessel carries more than one grade, and / or if not all tanks are used for loading or if one or more bottom lines remain empty after loading, the quantities to add or deduct to a grade due to bottom lines, need to be considered and entered accordingly in the ullage report.
In cases like our testship, where no bottom line quantities need to be entered, we could utilise L1, L2 and L3 for other tanks such as the Residual Oil Tank (if necessary).
Notice also that in pdf report settings we have changed the draft to 10.40 mtrs even keel upon completion of loading the first stage, and we have changed the setting of the ‘Before’ switch to ‘After’, to ensure that the ullage report shows ‘After loading’ instead of ‘Before Loading’.
Now let’s copy this ullage report into a new one, called ‘Testship after s2’, following the procedure as described above, and then we will open the newly copied ullage report in our tank editor and enter new ullages, volumes and density as shown in below ullage report.
Notice that in pdf report settings we have now changed the draft to 11.50 mtrs even keel upon completion of loading the second stage.
For the sake of convenience we will assume that all temperatures are still the same although in reality this is unlikely and we would normally do a full inspection including new temperatures. The new density is based on the mix by volume ratio of density of the first parcel (860.7) and the density of the second parcel (826.9):

Now that we have completed both ullage reports, we can have a look at how to generate the pdf / jpg, send it by email etc:
Upon completion of entering the data, after pressing the back button, we are back in the Tank Configuration screen. In the top right-hand corner of this screen there is an options menu, which if we press it, will shows links to ‘Current Totals’, ‘Settings’ etc and also ‘Pdf/jpg Reports’:

Pressing the link to ‘Pdf/jpg Reports’ will bring us to the Pdf reports section, where we can press on ‘Ullage Reports’ in order to generate our pdf or jpg image for the ullage report:

Now when we press ‘Ullage reports’, we will be presented with the list of available ullage reports:
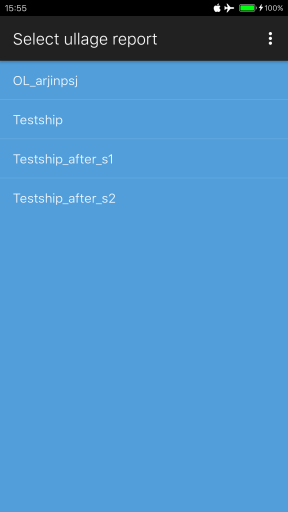
As you can see, both ‘Testship_after_s1’ and ‘Testship_after_s2’ are in the list. If you press ‘Testship_after_s1’ you will be presented with the list of available grades within this report.
Normally there are always at least two entries in the list of grades: one entry called ‘TotalsAllGrades’, and one entry with a grade name that you have chosen when you created the ullage report. All existing grade names in the report will be listed here, and pressing a grade name will then produce an ullage report which will show only tanks containing that grade.
If you press ‘TotalsAllGrades’, the ullage report will show all tanks and a total cargo table, plus a breakdown of totals per grade. If you have entered only one grade, then there is no difference between selecting the grade name or selecting ‘TotalsAllGrades’, the report will be exactly the same.

So let us select the ‘ma’ grade. The first time you do this, the app will immediately show the pdf file (or the jpg image, more on that later) of the report as shown above. If later on you want to see the report again, the app will ask you ‘Entry exists, overwrite?’. If in the meantime you have made changes to the ullage report (changed ullages, or densities etc), then you need to select ‘OK’ and let the app overwrite the file.
After viewing the pdf or image file, if you press the back button, you will be asked if you want to send the ullage report by email; if you press ‘OK’ the app will then let you choose which email application to use (if you have more than one), and after selecting your preferred mail app, the mail composer shows up, with the pdf or jpg file already attached, and the subject of the mail entered as ‘Ullage Report (Pdf)’.
Also, if you have entered email addresses in the Pdf report settings, these addresses will already have been entered in the ‘To’ and ‘CC’ line. A maximum of 2 addresses will be entered in the ‘To’ line, and a maximum of 2 addresses will be entered in the ‘CC’ line. As you can see in the Pdf report settings screenshot below, a maximum of 4 email addresses can be entered automatically in the email. These addresses can either be entered manually, or be selected from your contacts. The first time you try to select addresses from your contacts the app will ask your permission to access your contacts.

After composing the email, it will either be sent to your outbox, or sent onto the web if you are connected and press the ‘send’ button in your email app. Once you close your email app, Cargo Surveyor will ask you if you wish to export the data to a csv file, and if you press ‘OK’ on that dialog, it will also ask you if you wish to send the csv file by email.
Both the pdf (or jpg) file and the csv file are stored on the internal storage of your phone. The pdf and the csv file can normally be found in the root of your internal storage. If you have opted to generate a jpg file (or if your phone runs an Android version lower than Kitkat – 4.4), a jpg file will be generated which will be saved in a directory called ‘saved_images’ in the root of your storage.
Cargo Surveyor will automatically detect if your phone is capable of generating pdf files, and will by default select the pdf format for reports if possible. If your phone is using an Android version below Kitkat 4.4, Cargo Surveyor will disable the choice between pdf and jpg, and will only produce jpg files.
What is the purpose of the csv (comma separated value) file? All the data inside the ullage report is put into a small text file, where each entry (this can be a number, or a combination of words) is separated from the next entry by a comma. This file can be opened by Microsoft Excel, and can be used to import the data from the ullage report into an excel spreadsheet. For advanced users it would also be possible to copy the exported csv file to another file (provided that you use the correct naming conventions etc) and generate a completely new ullage report from a desktop computer, which could then be imported to the phone by simply copying the csv file to the phone. More on that in a later tutorial.
In Cargo Surveyor this file is also used to backup and restore an ullage report (and most of the other reports can also make use of this). If you export an ullage report to csv, and wish to transfer the report to another phone where you also have Cargo Surveyor installed, all you have to do is copy the csv file to the other phone, and import the file into Cargo Surveyor on the other phone.
Another purpose is in case of corruption of the app, or if you completely uninstall the app and later want to re-install; if you have exported all your reports, it is very simple to import the csv files and have all your reports back with a minimum amount of effort.
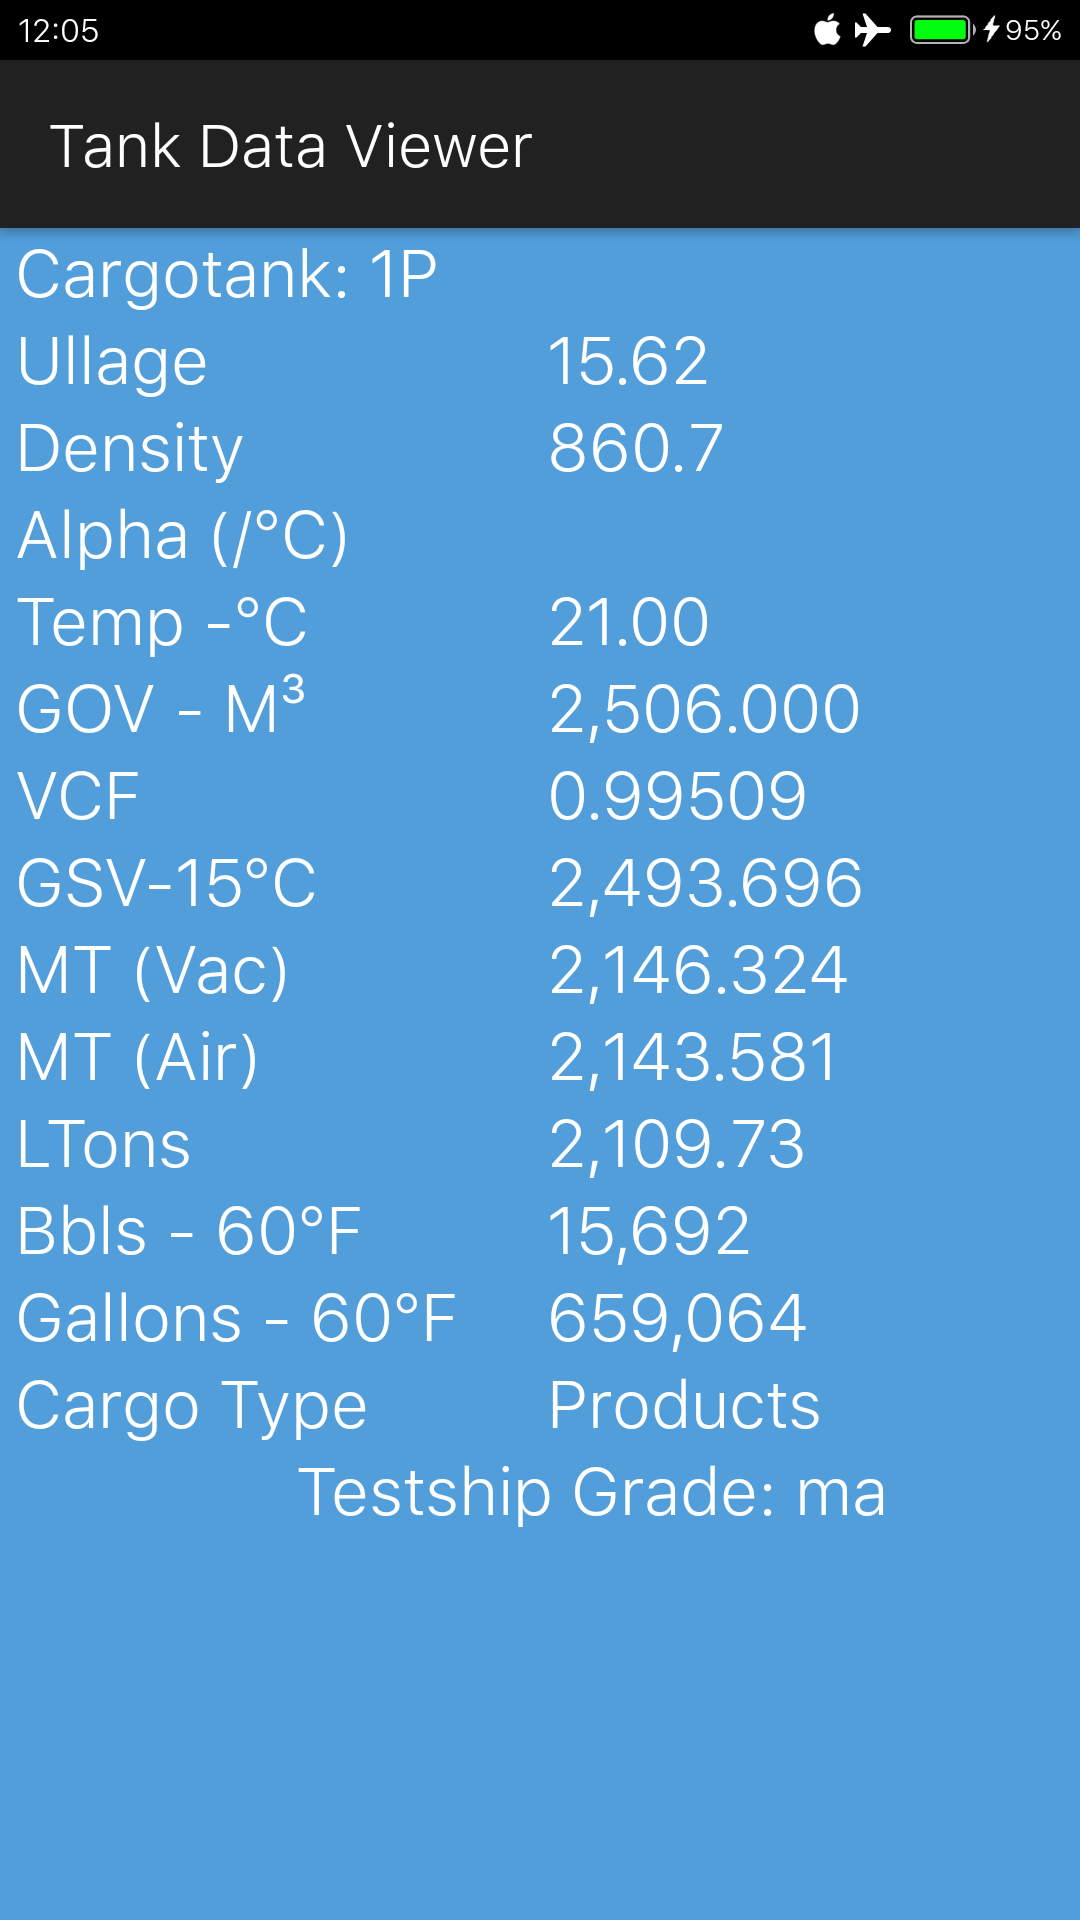
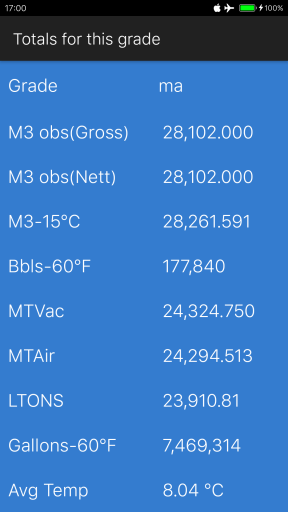
We mentioned earlier in this tutorial the existence of an options menu in the top right-hand corner of the Tank Configuration screen; if you press the menu button and select ‘Current Totals’ while an ullage report has been loaded into memory, it will take you to a screen with the list of all grades within that ullage report and you can select a grade to view its totals.
Alternatively you can select the entry ‘Totals’ in the options menu, and select any existing ullage report, and then view for that selected ullage report its grand totals, or the totals for any grade:
Well, we have come to the end of tutorial no.7. In the next tutorial we will discuss the transfer executive summary.
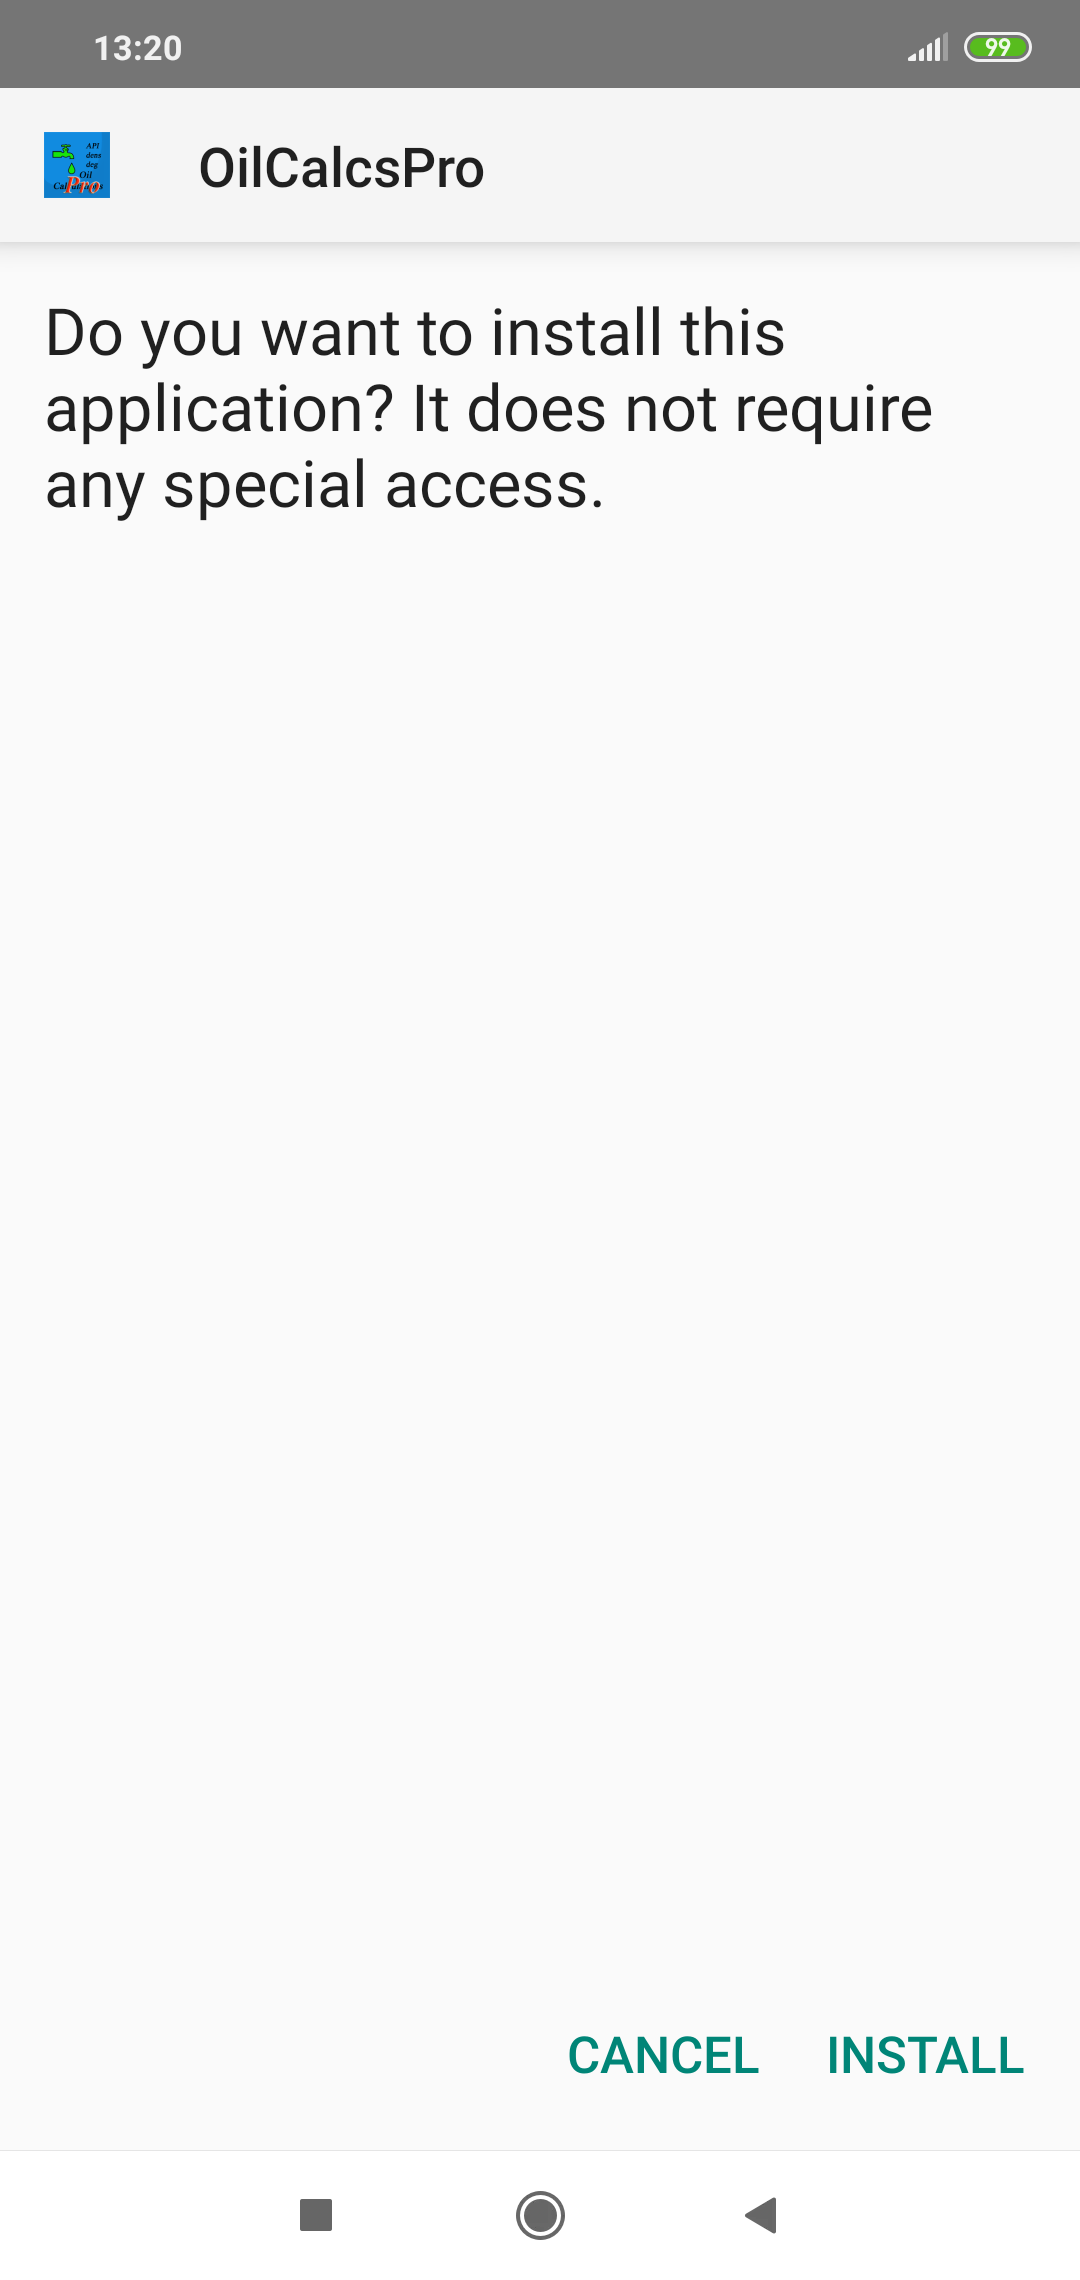
In the mean time, for those who are interested in Cargo Surveyor for Android: the app can be downloaded here:

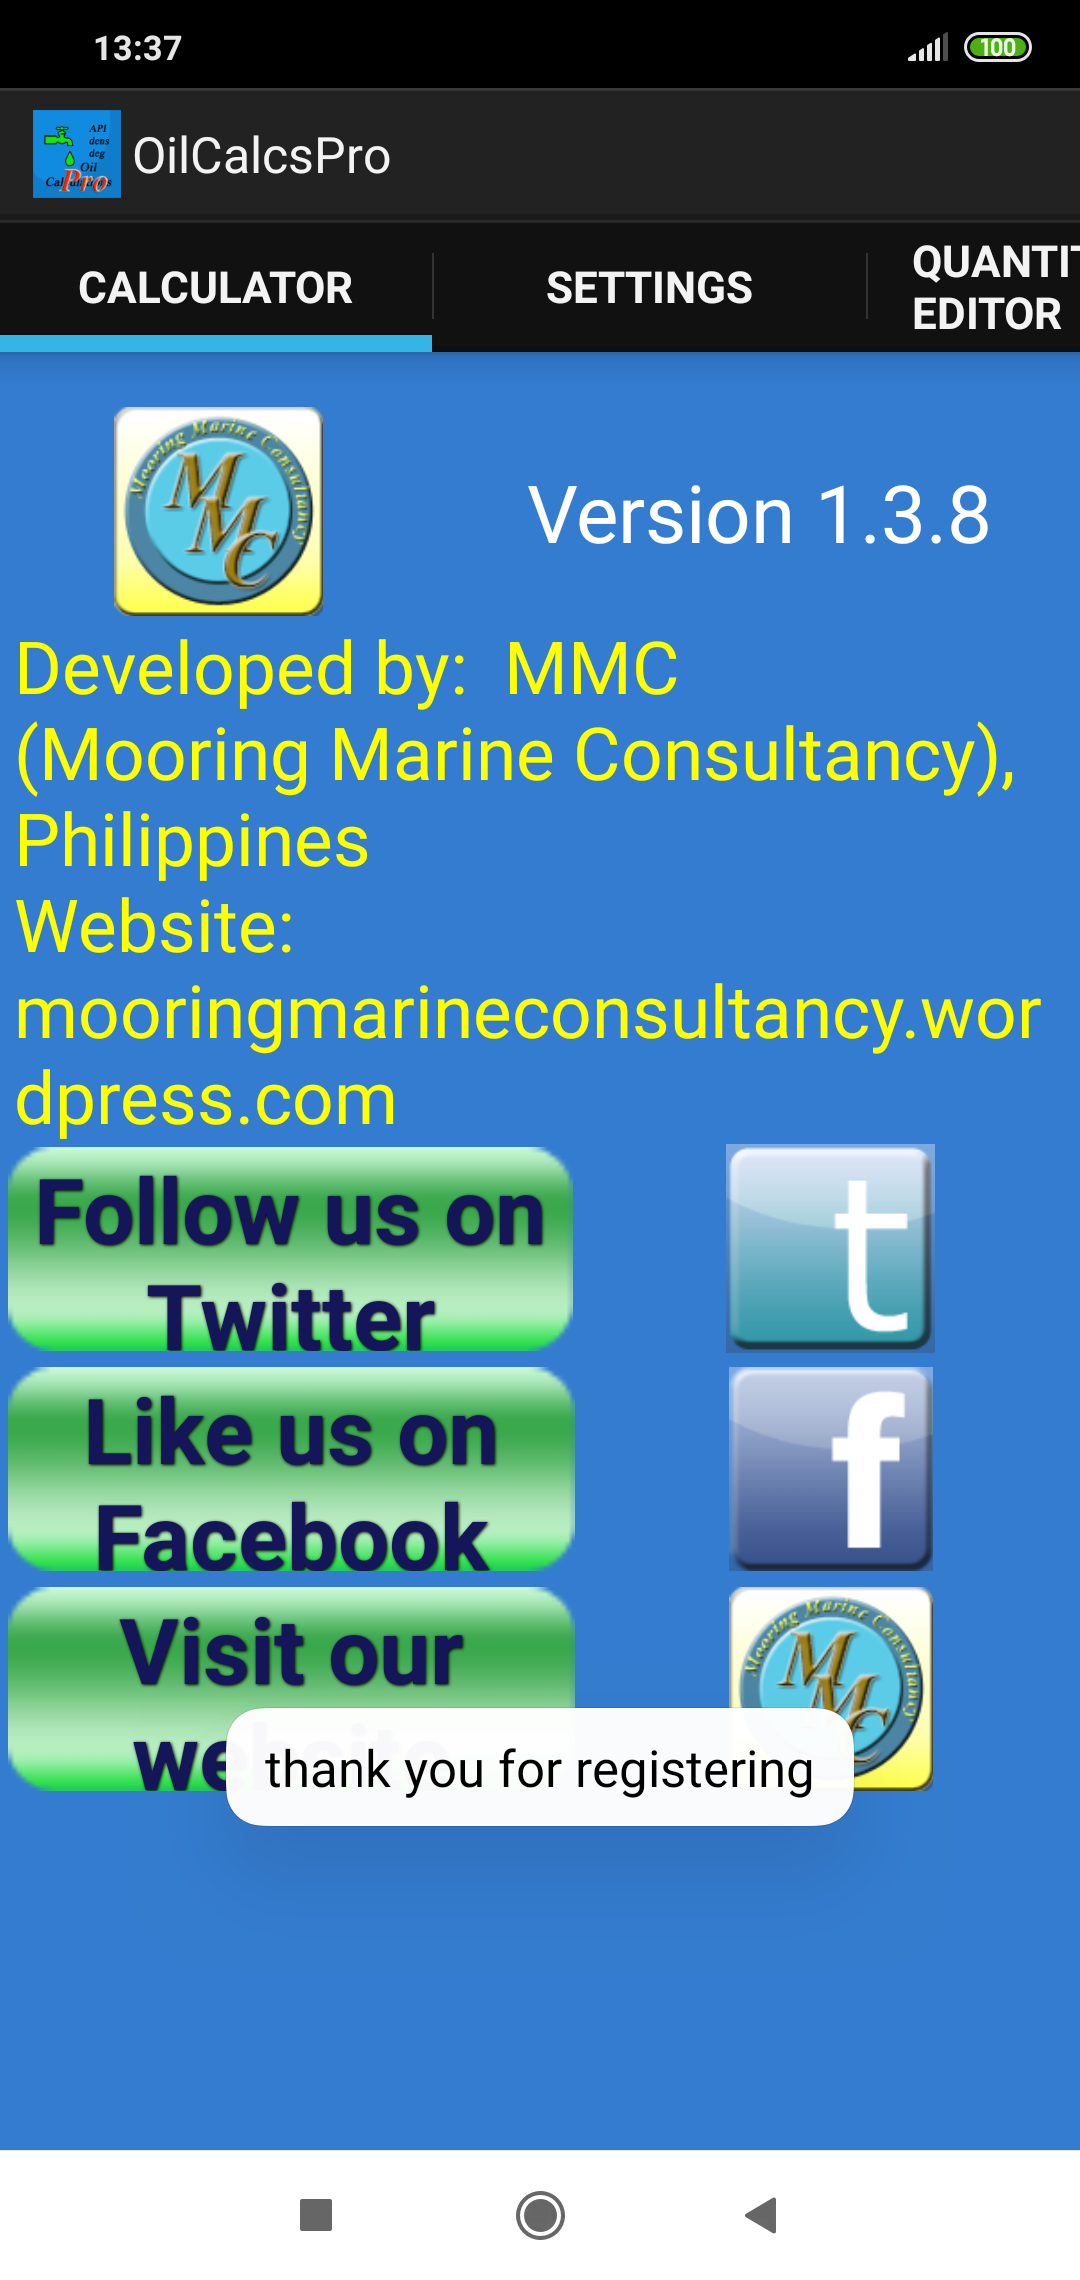
We post updates for the app in Google Play frequently to solve minor bugs, and advise all users to update as soon as a new update is available; we don’t use advertisements in Cargo Surveyor and we never will.
If you have any queries, suggestions, comments, criticism about the app or this blog post, please let us know! We always do our best to accommodate any requests for additions/modifications to our apps if they improve the value!