CargoSurveyor 1.6.2 for iOS – Ullage Reports 101

In this article we discuss the various options that are available to tailor ullage reports to our specific needs.

The ullage reports section in the latest version of CargoSurveyor has two major differences in comparison to the older version:

  • While the older versions were limited to a maximum of 26 tanks, the new version can create reports with a maximum of 53 tanks.

  • The older versions of the ullage report did not have any configuration options other than the titles in the header. The new version lets the user decide which units need to be printed, whether the VCF is calculated for each individual tank or only for the total cargo volume for each grade, based on the average temperature for that grade.

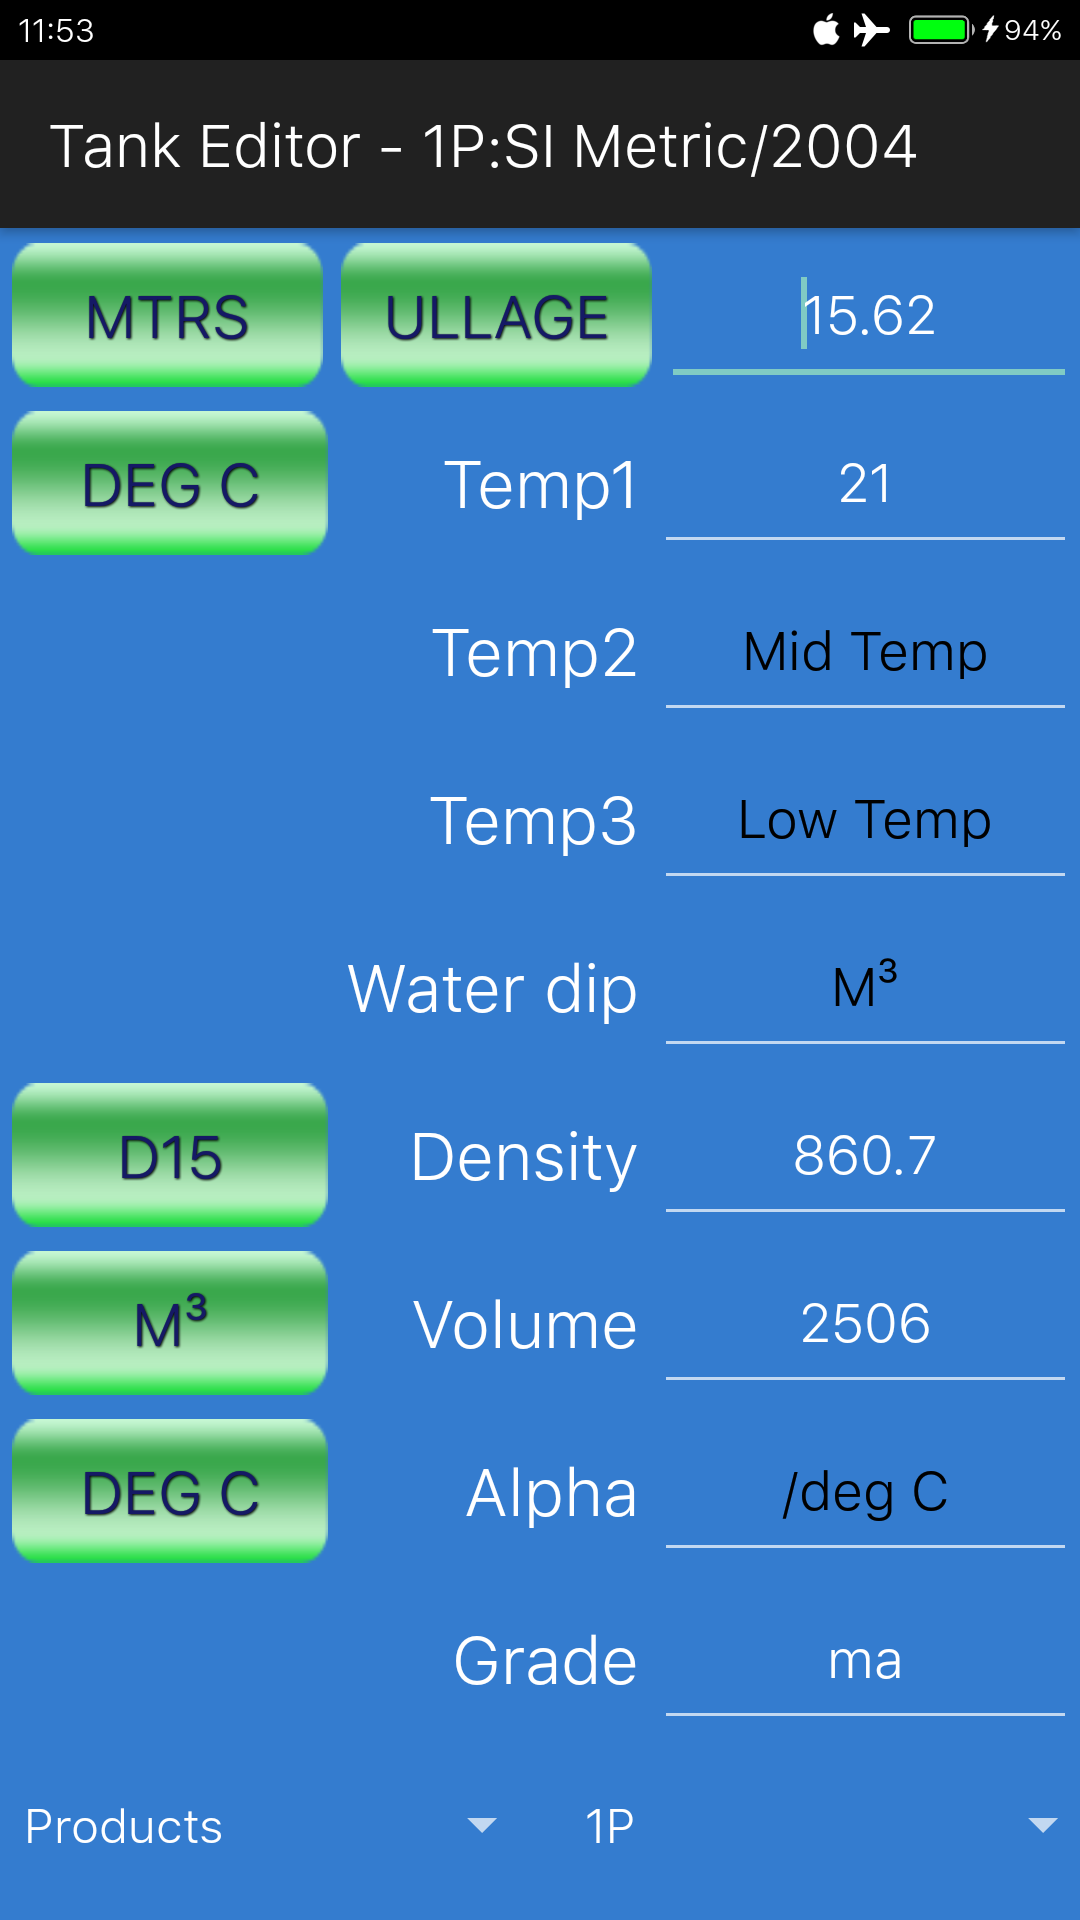
Aside from that, another albeit minor difference is that the entries on the tank editor screen have slightly changed; in the old version there were three fields for temperature, but these have been replaced with one single entry for temperature, plus one field for ‘tape correction’ as well as a field for ‘water dip’ both in cm/inches. The reason behind this change is that in the ReferenceHeights and Raw Measurements report the user can record his raw ullage and temperature values, so there really is no need for three temperature fields within the tank editor.

Let us first examine where exactly the major differences occur, and what the configurable options are:

1. When we need to create a new ullage report, we first decide on the number of tanks and the tank configuration. Let’s take for example a fuel barge with 9 sets of wing tanks, loading a cargo of heavy fuel oil with a density of 990.

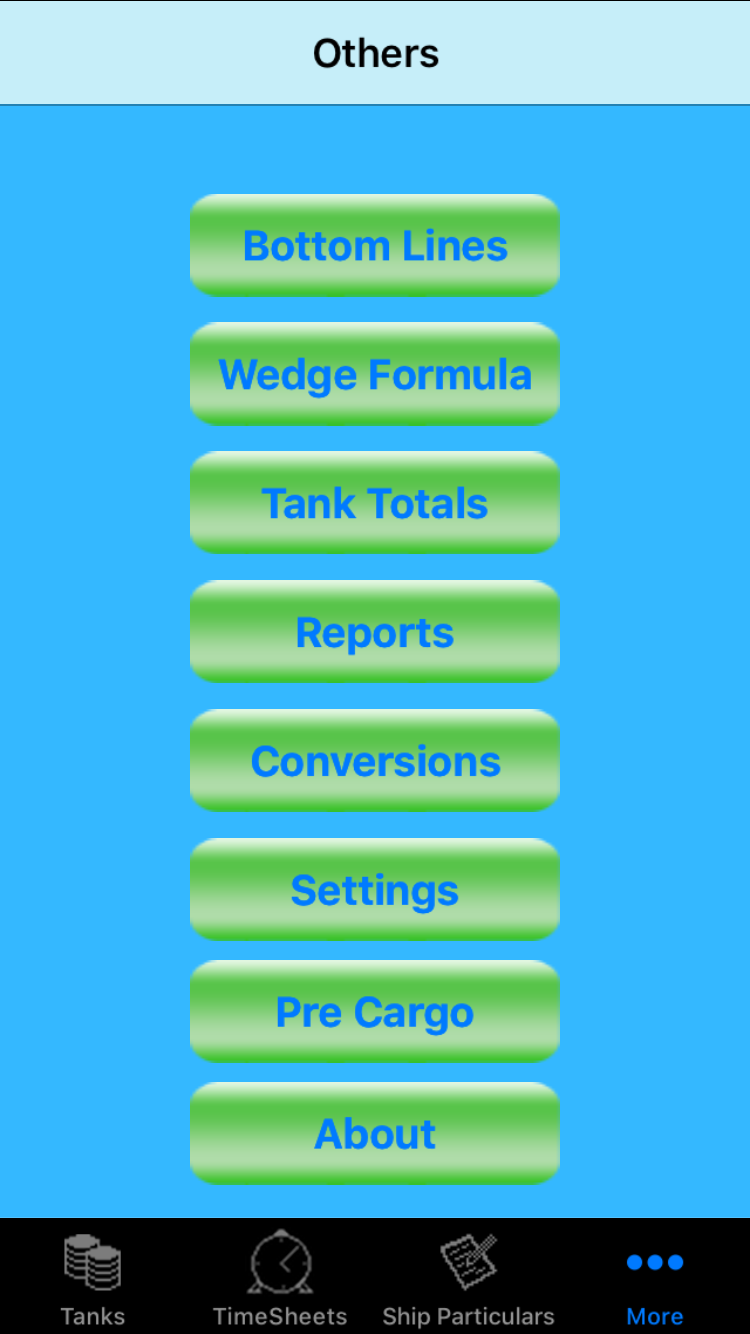
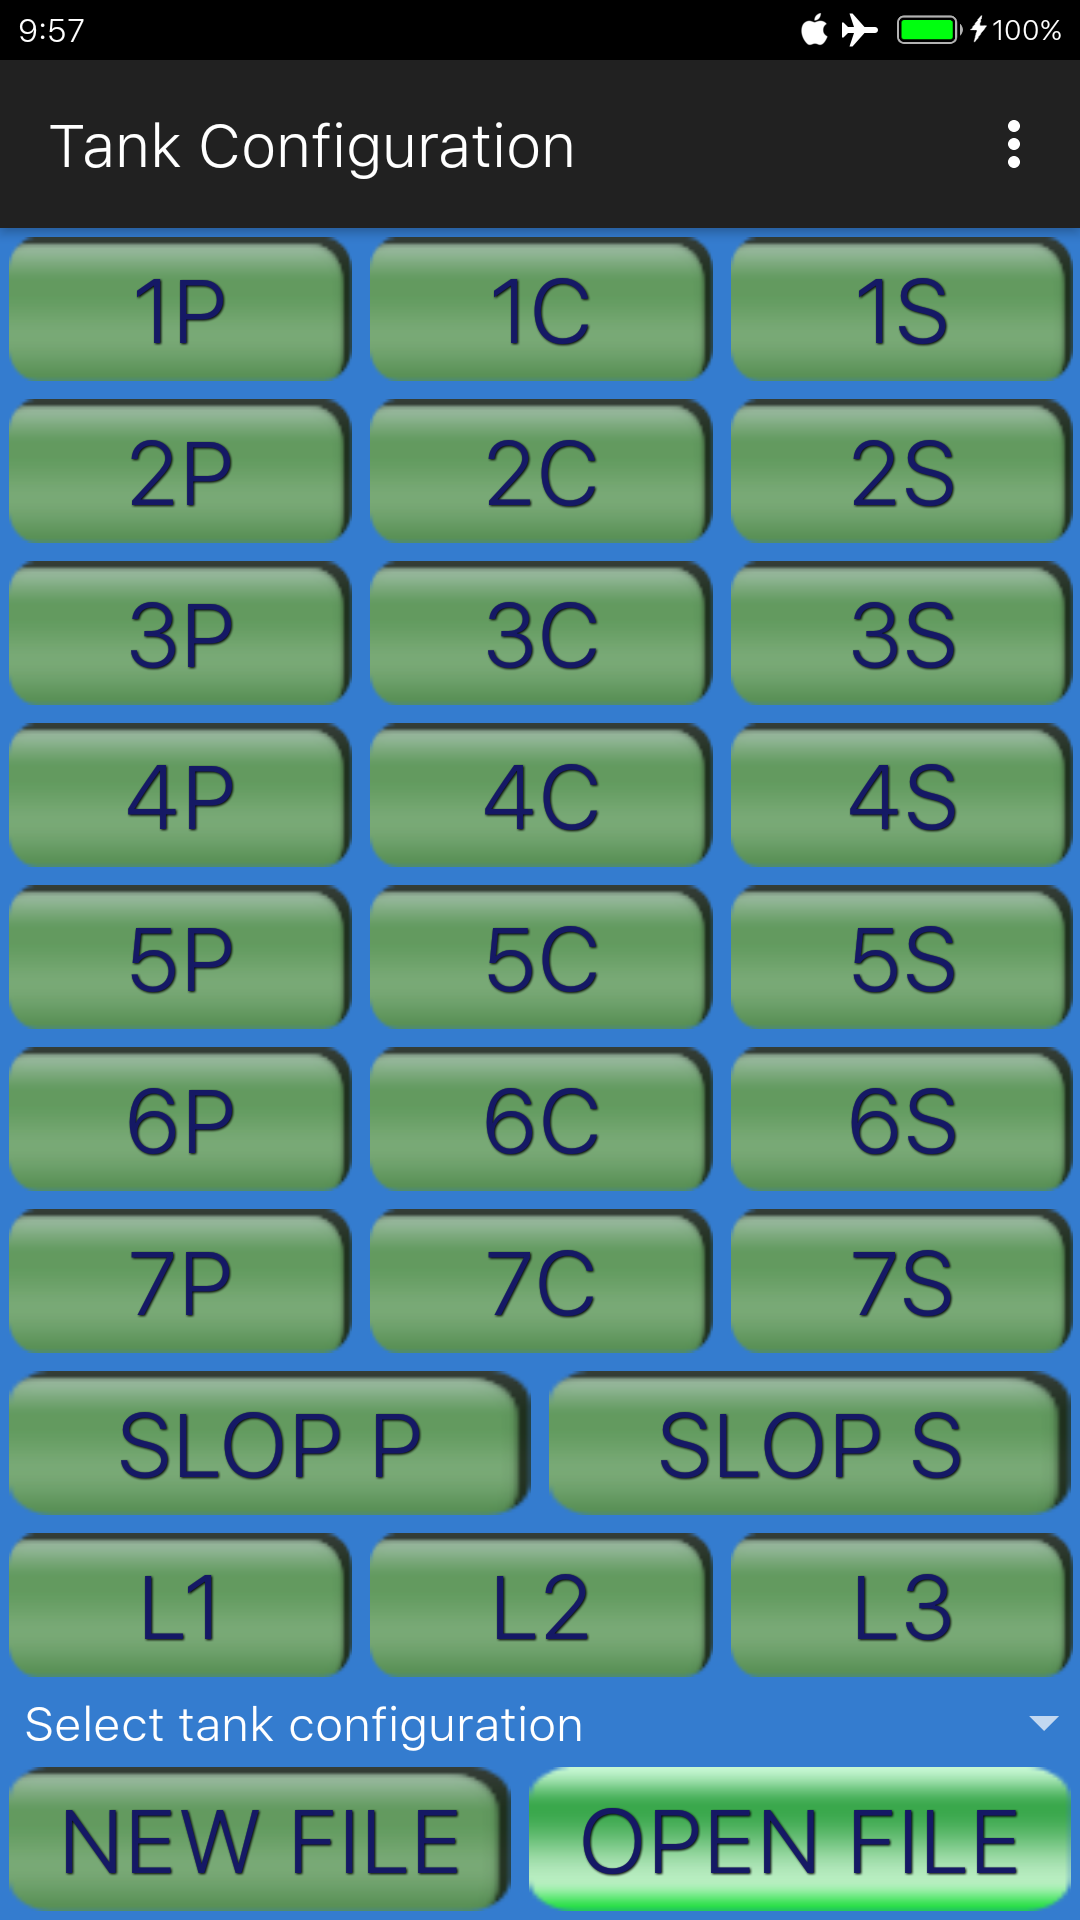
2. Upon opening the app, we go to the ‘Tanks’ tab and press the ‘Extended’ button: the Standard layout gives us a maximum of 7 center tanks plus 7 sets of wing tanks (plus two slop tanks and 3 bottom lines), which is not enough for our barge with 9 sets of wing tanks:
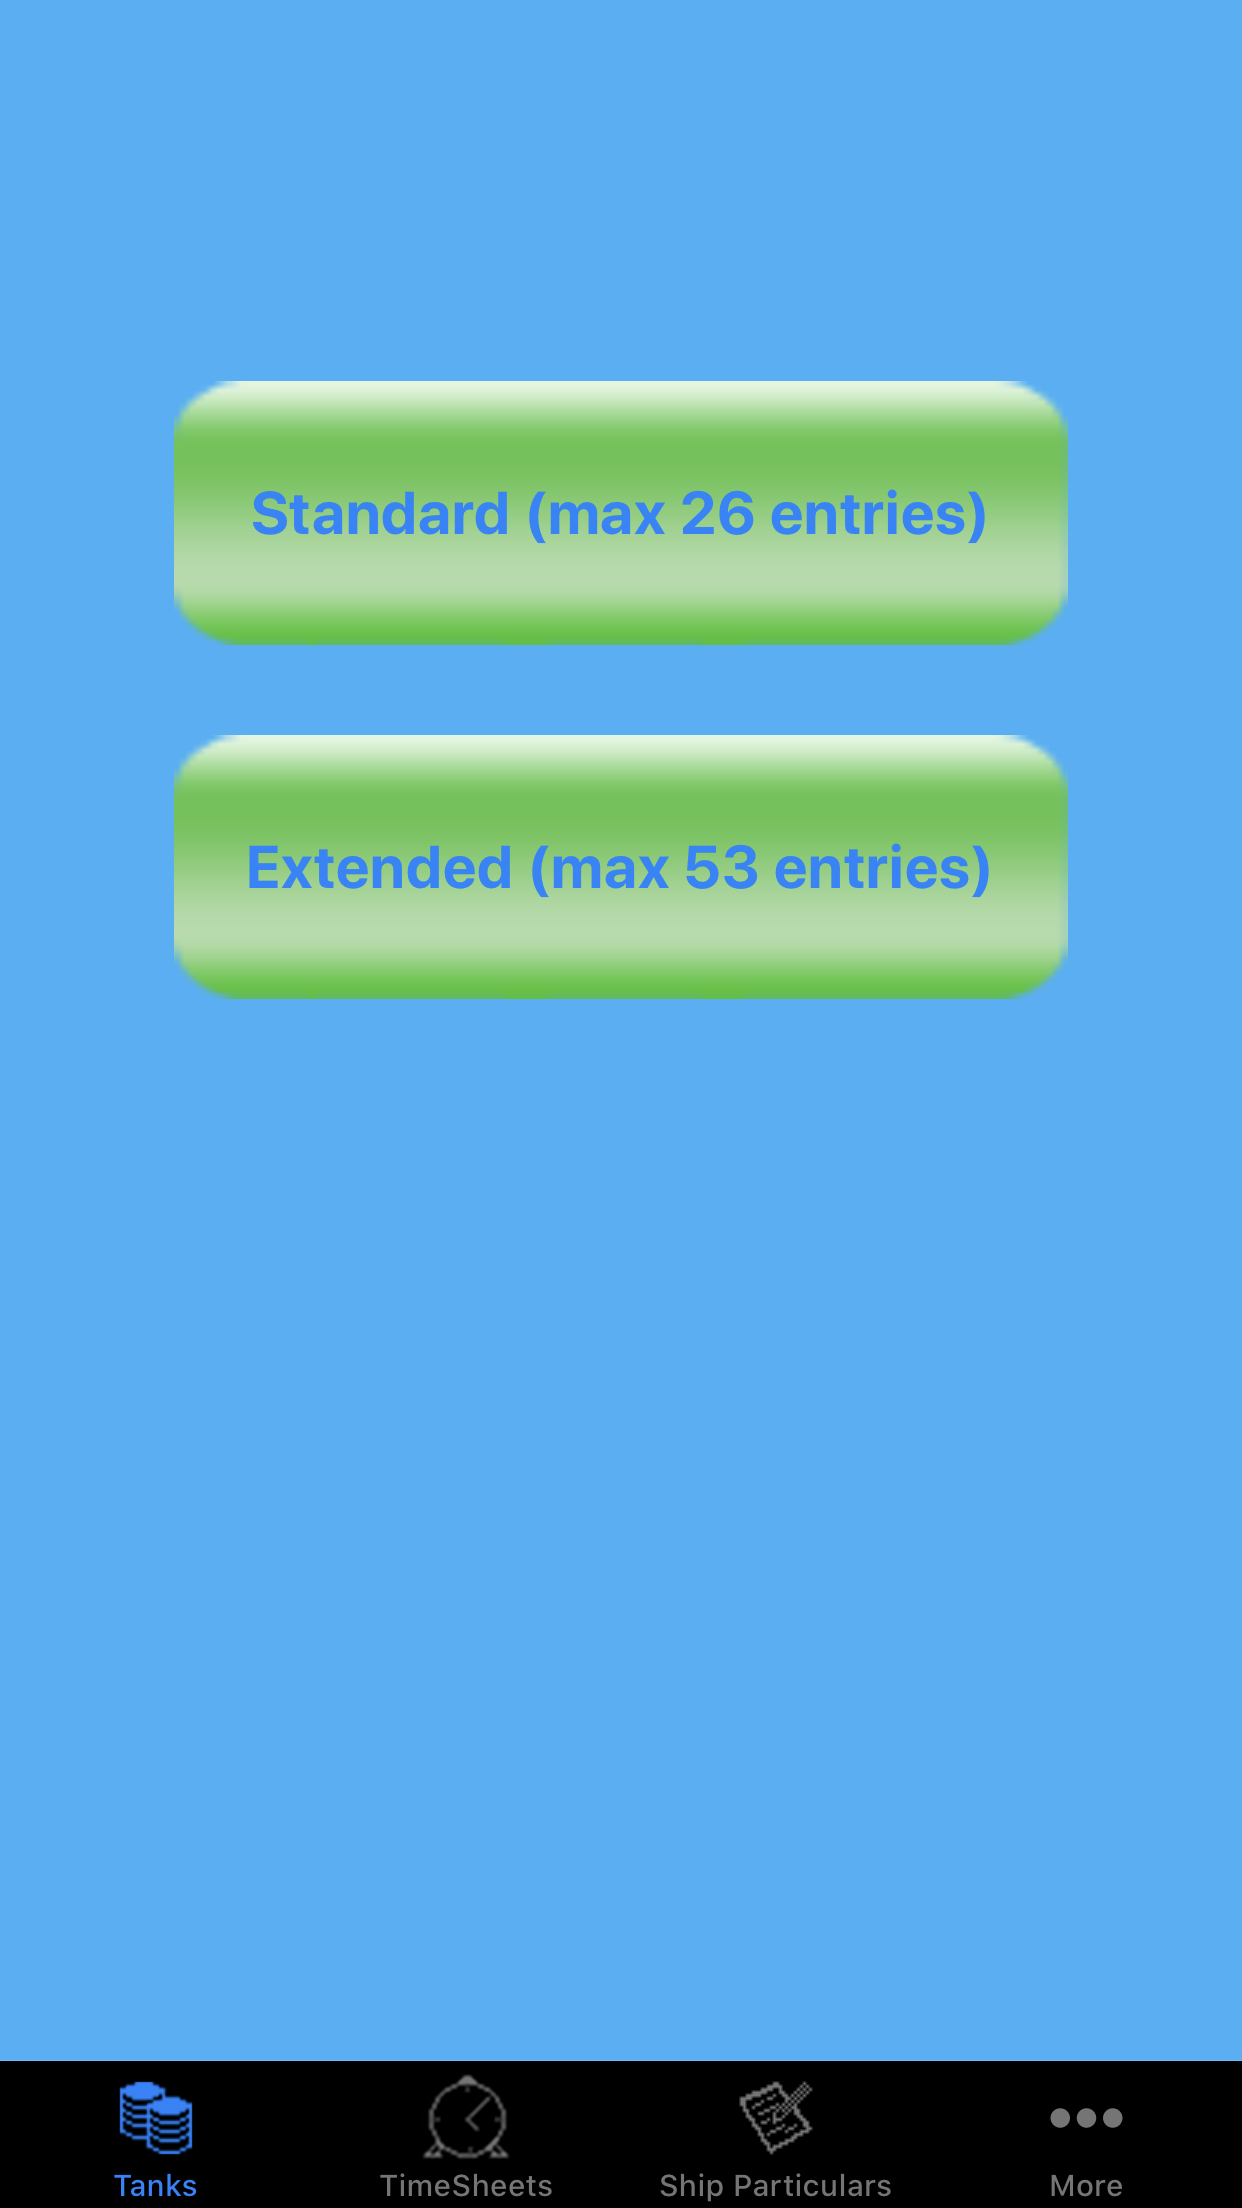
Choose standard or extended

Main entry screen

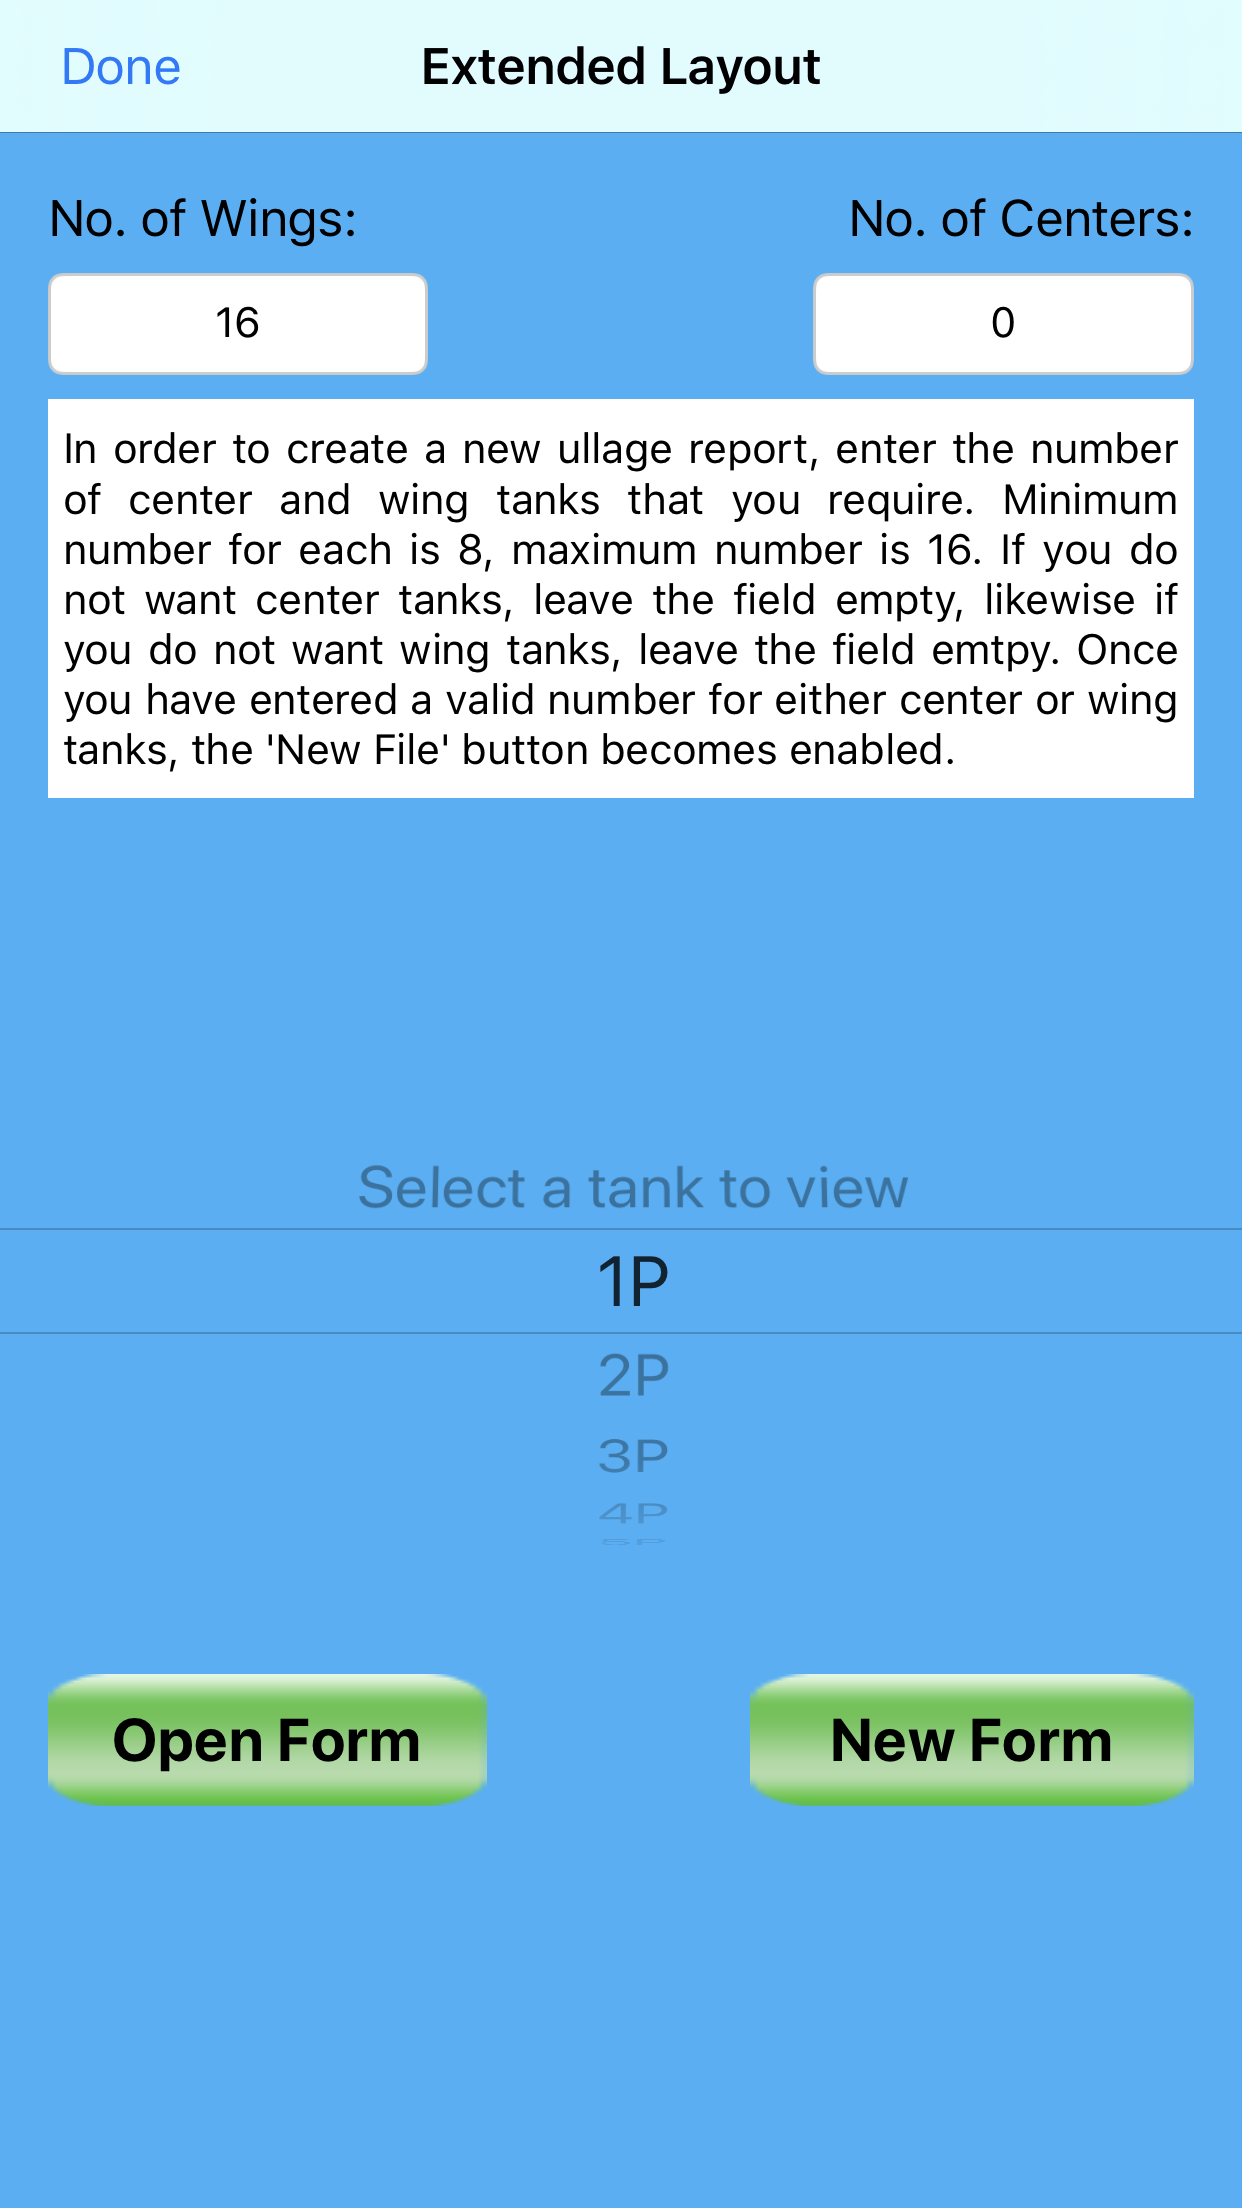
3. As soon as we press the ‘Extended’ button, the Tank Configurator screen shows up, where we can enter the number 9 in the text box for wing tanks, in the top of the window on the left:

As soon as you enter the number, the ‘New Form’ button becomes enabled:

4. As soon as we press the ‘New Form’ button, the Tank Editor screen shows up, with a dialog on top where you can enter the file name of the report. For this exercise, let’s enter ‘testship’:

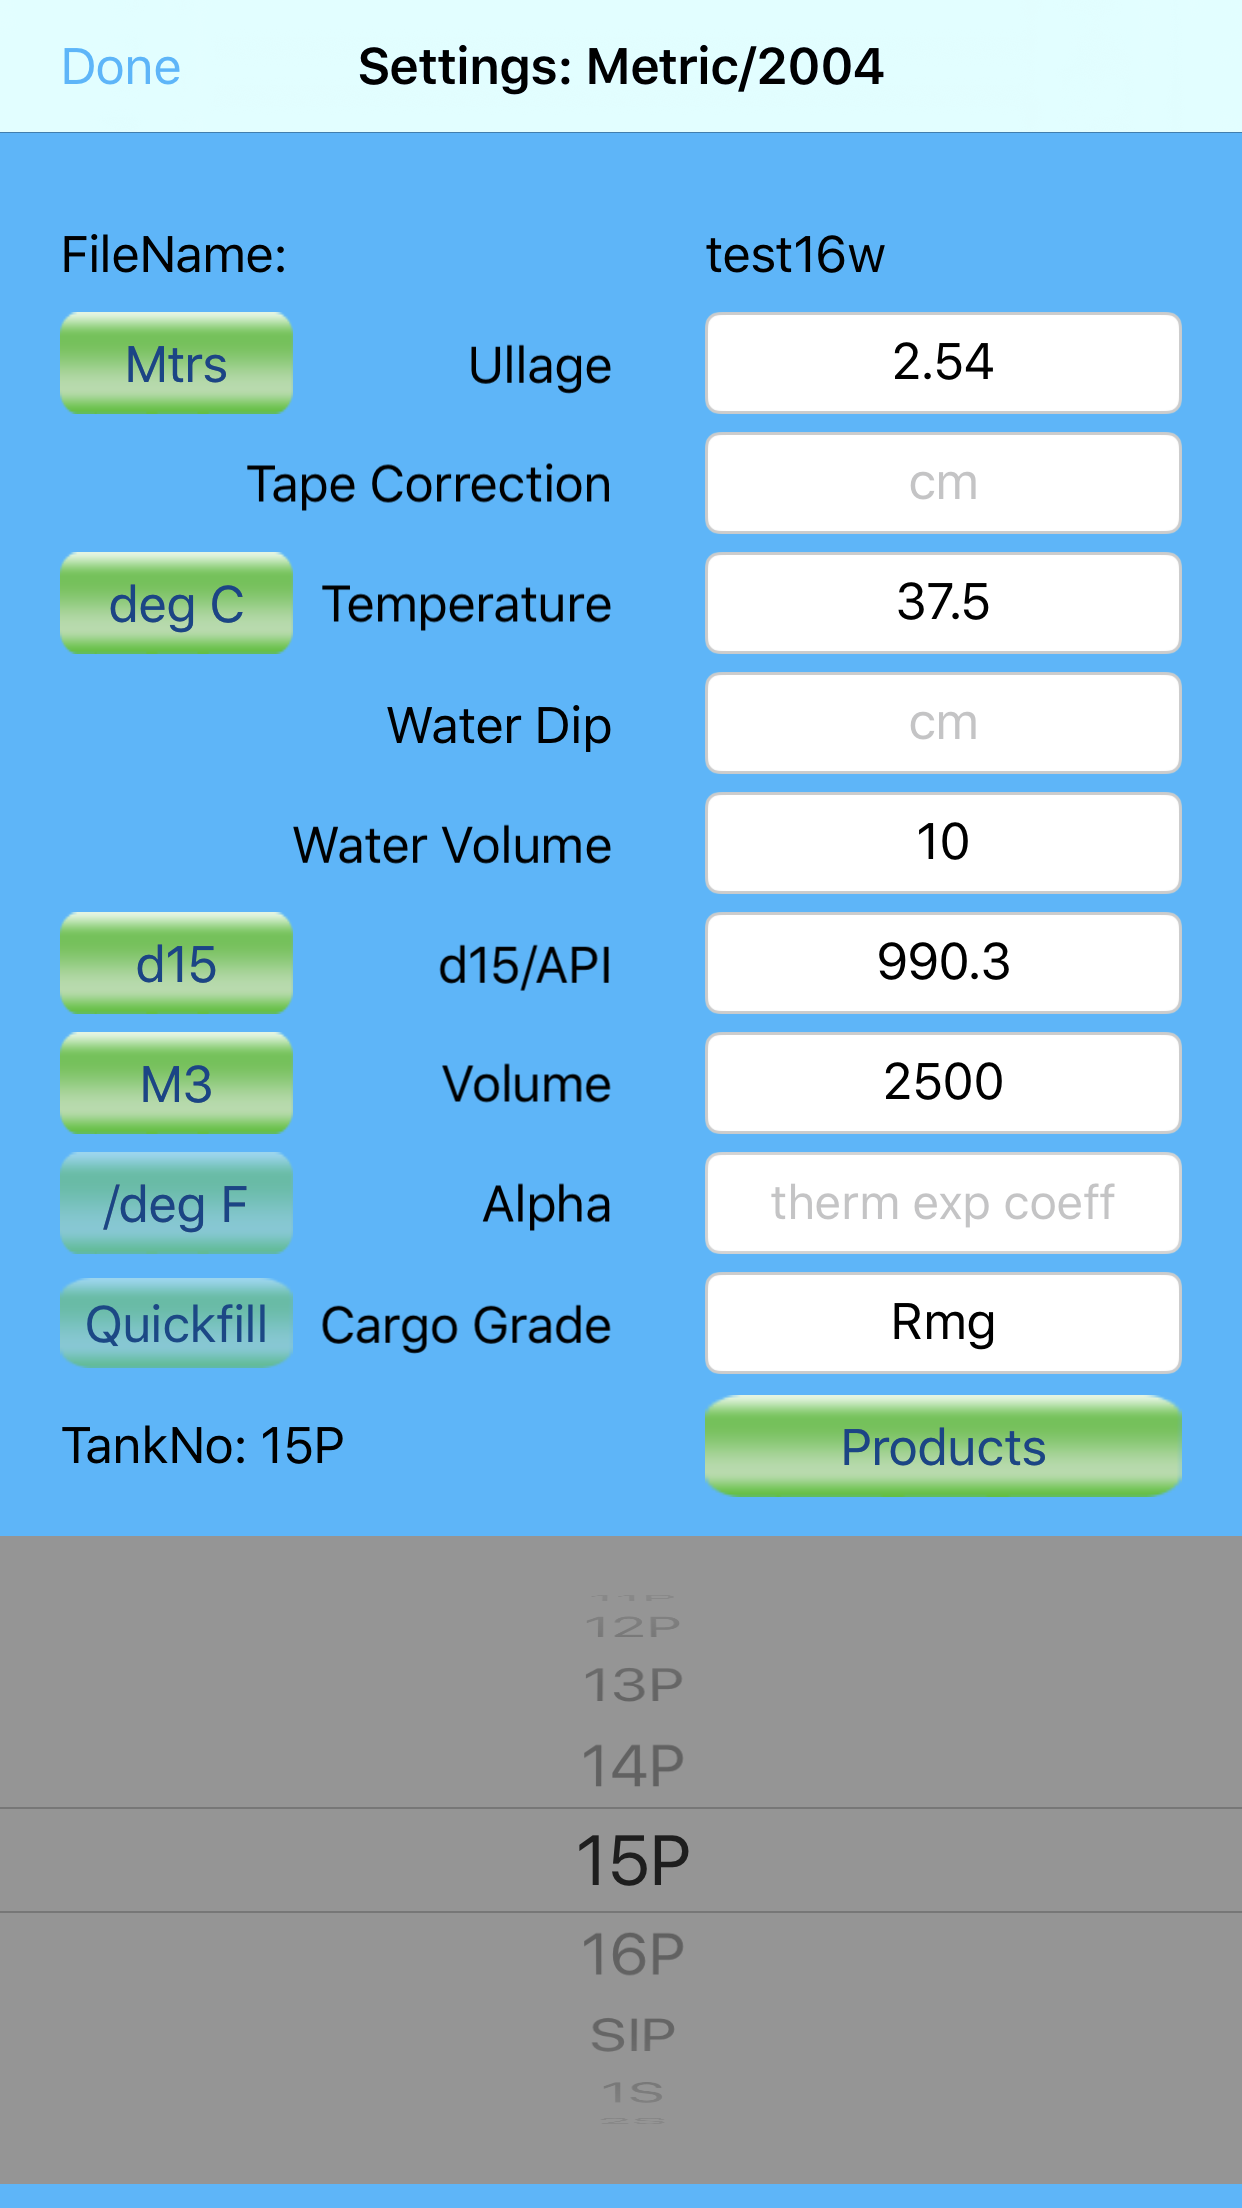
5. After pressing ‘OK’, the dialog disappears, and we can now see the tank editor in full, with all tanks showing on the picker. As yet all fields are empty, and since we are going to attend the loading of this barge knowing that she will load just one grade of fuel with a density of 990, we can use the ‘Quickfill’ button to enter in advance the density and grade name for all tanks:

6. After pressing ‘Quickfill’, a dialog disappears, where we can enter values for ullage, water, temperature, density, volume, thermal expansion coefficient (alpha), grade name and a single letter that represents whether we want to apply this information to port side tanks / starboard side tanks / wing tanks/ center tanks / all tanks / odd tanks or even tanks (P/S/W/C/A/O/E).

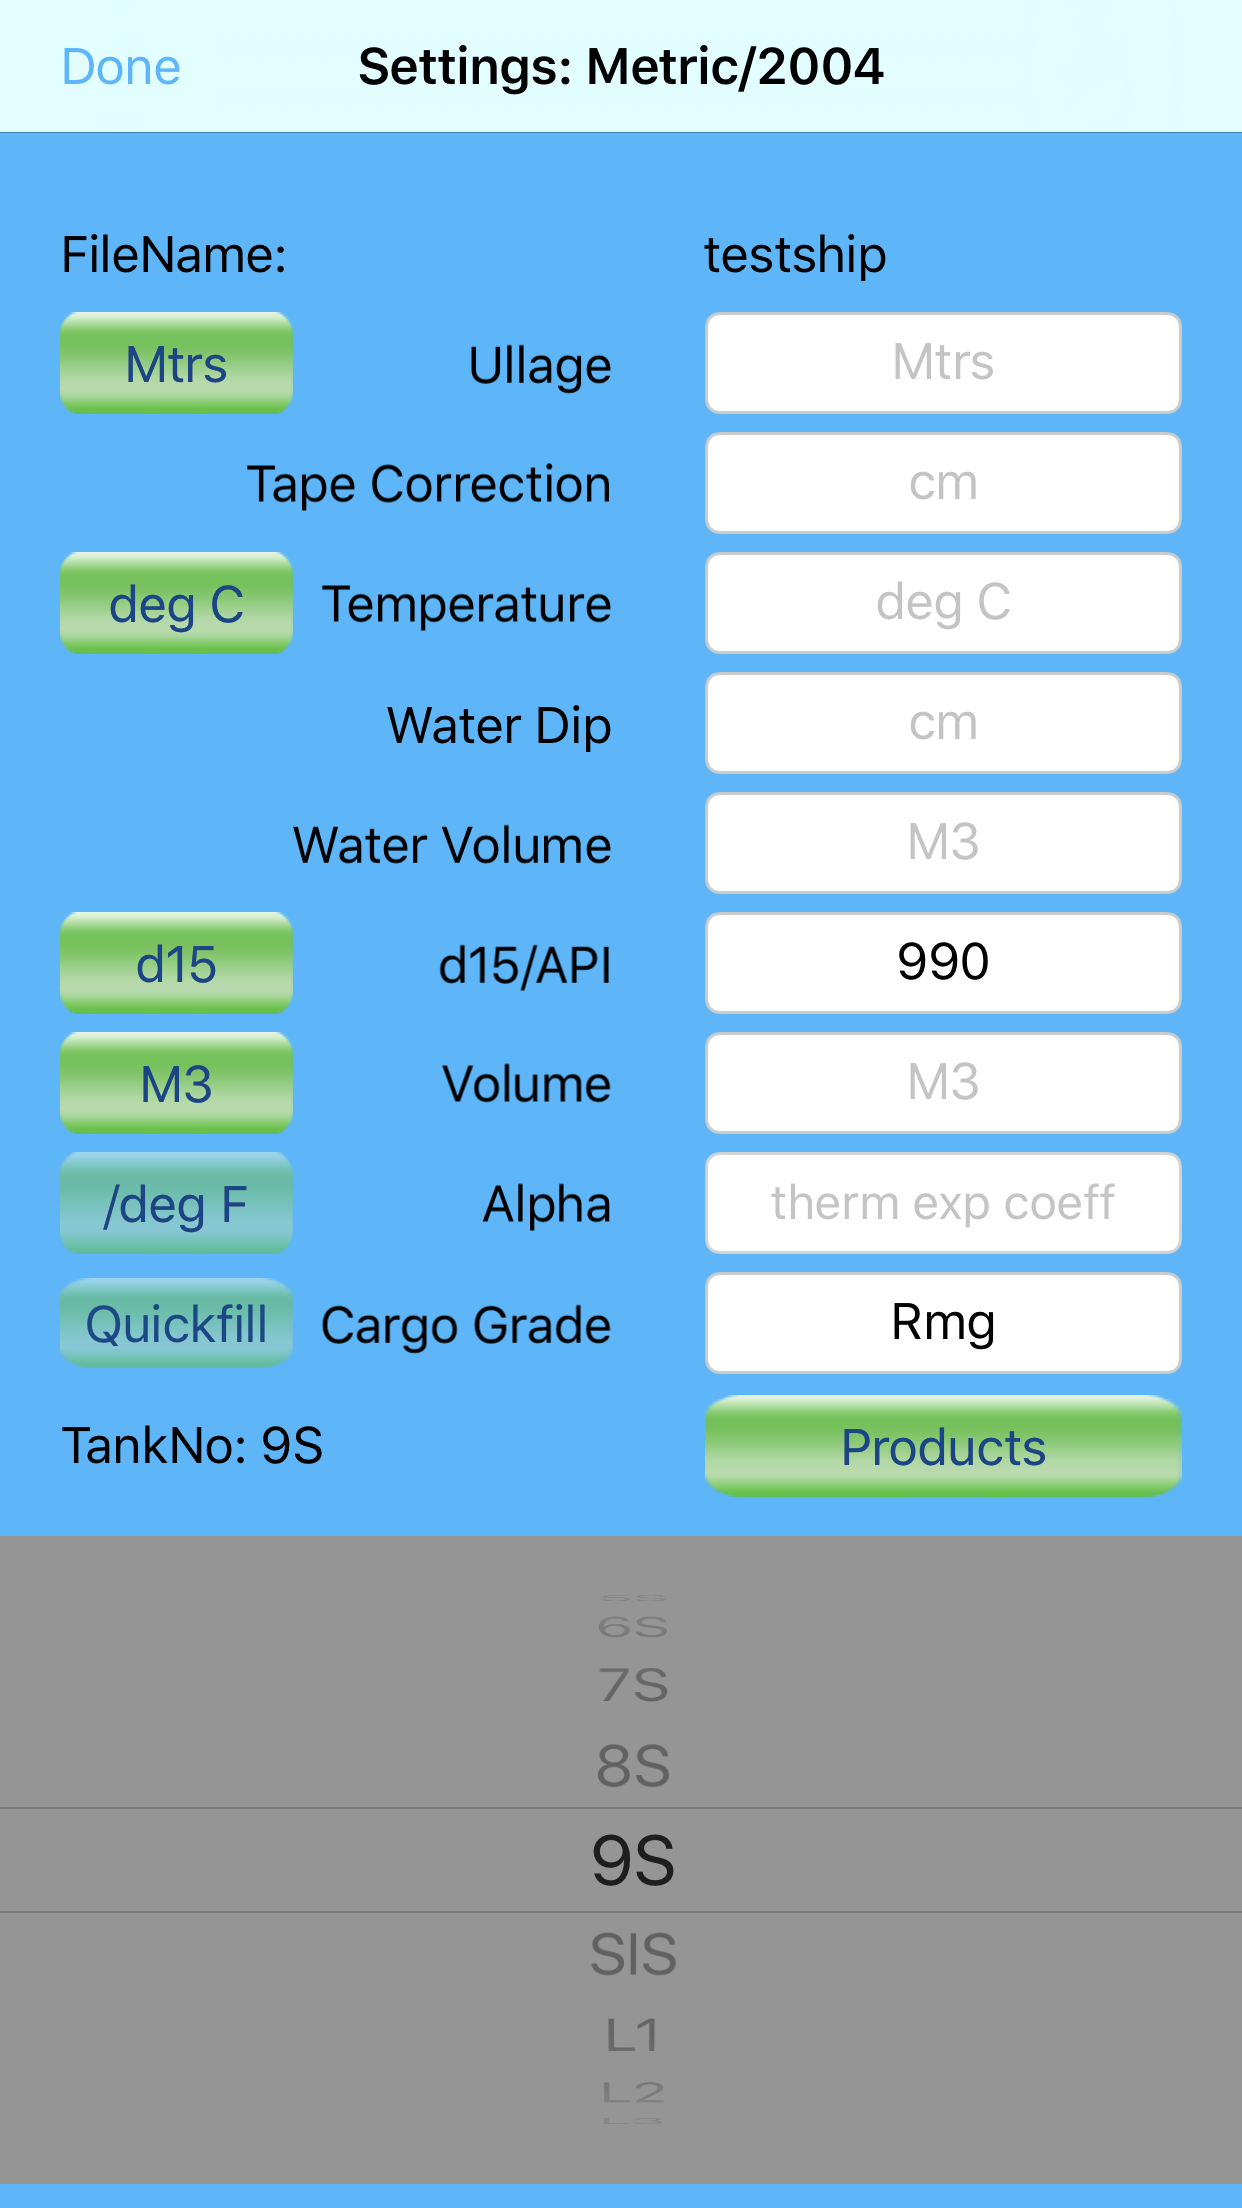
7. For this exercise we will enter ‘990’ in the ‘Density’ field, and ‘Rmg’ for ‘Grade name’. If we don’t enter a letter for the bottom field, the information will be applied to all tanks:

8. After pressing ‘OK’ you will see that the two values have been entered, and applied to all tanks. The screenshot below shows tank 9S. You will notice that the ‘Quickfill’ button is now disabled; the button is only enabled if the first tank (in this case ‘1P’) is selected.

9. The current example being a barge, we will delete density and grade name for the two slop tanks and the three bottom lines. But first we can use quickfill again to fill all tanks with an oil volume, and set a temperature as well as an ullage for each tank.

For this example, we will enter a volume of 500 M³ for all odd tanks (1, 3 etc), and a volume of 400 M³ for all even tanks, with a temperature of 51.2 ºC for all loaded tanks. We spin the picker back to the first tank to enable ‘Quickfill’, press it and enter the following values:

  • ullage: 2.50 mtr

  • temperature: 51.2

  • volume: 500 M³

  • letter ‘O’ (or ‘o’), both small letters and capitals are recognized

Now we press ‘OK’, and press ‘Quickfill’ again, and enter the following values:

  • ullage: 3.50 mtr

  • temperature: 51.2

  • volume: 400 M³

  • letter ‘E’ (or ‘e’), both small letters and capitals are recognized

After pressing ‘OK’, we are now done with entering the required data. Now we can erase the data entered in the two slop tanks and three bottom lines. This will need to be done manually, by selecting each tank / bottom line and clearing all fields. It is possible to erase the contents in desired fields for all tanks using Quick fill by entering ‘000’ in each field that you want to be cleared.

10. in order to print our ullage report, there are several things that need to be set up to ensure that the report is printed the way we want. Prior to printing we should also have a look at the totals for our testship, to make sure that we did not make any mistakes, and that the total matches with our expectation:

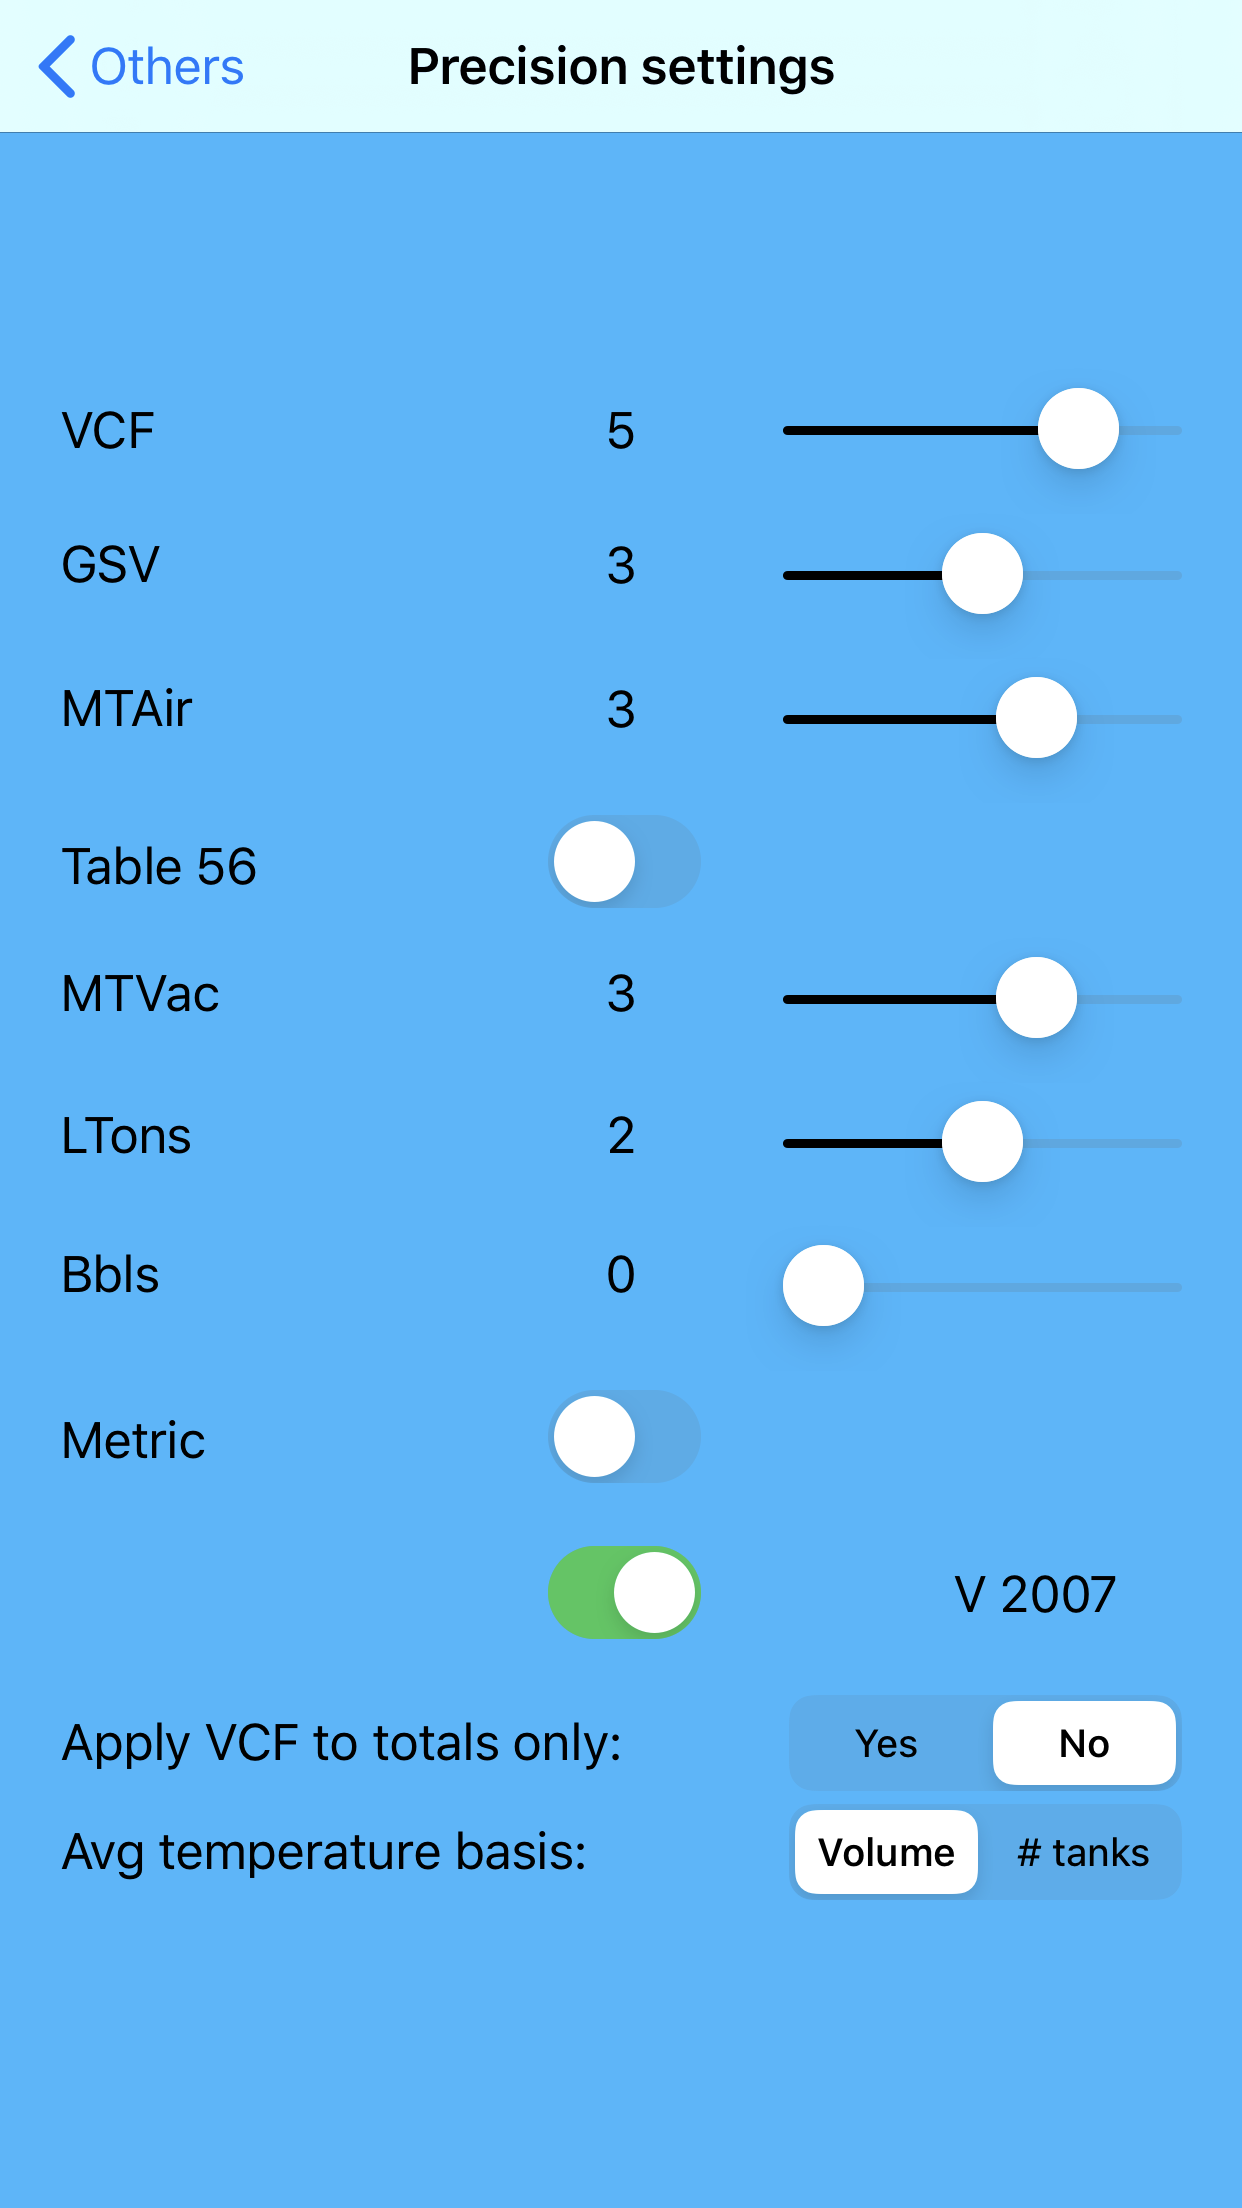
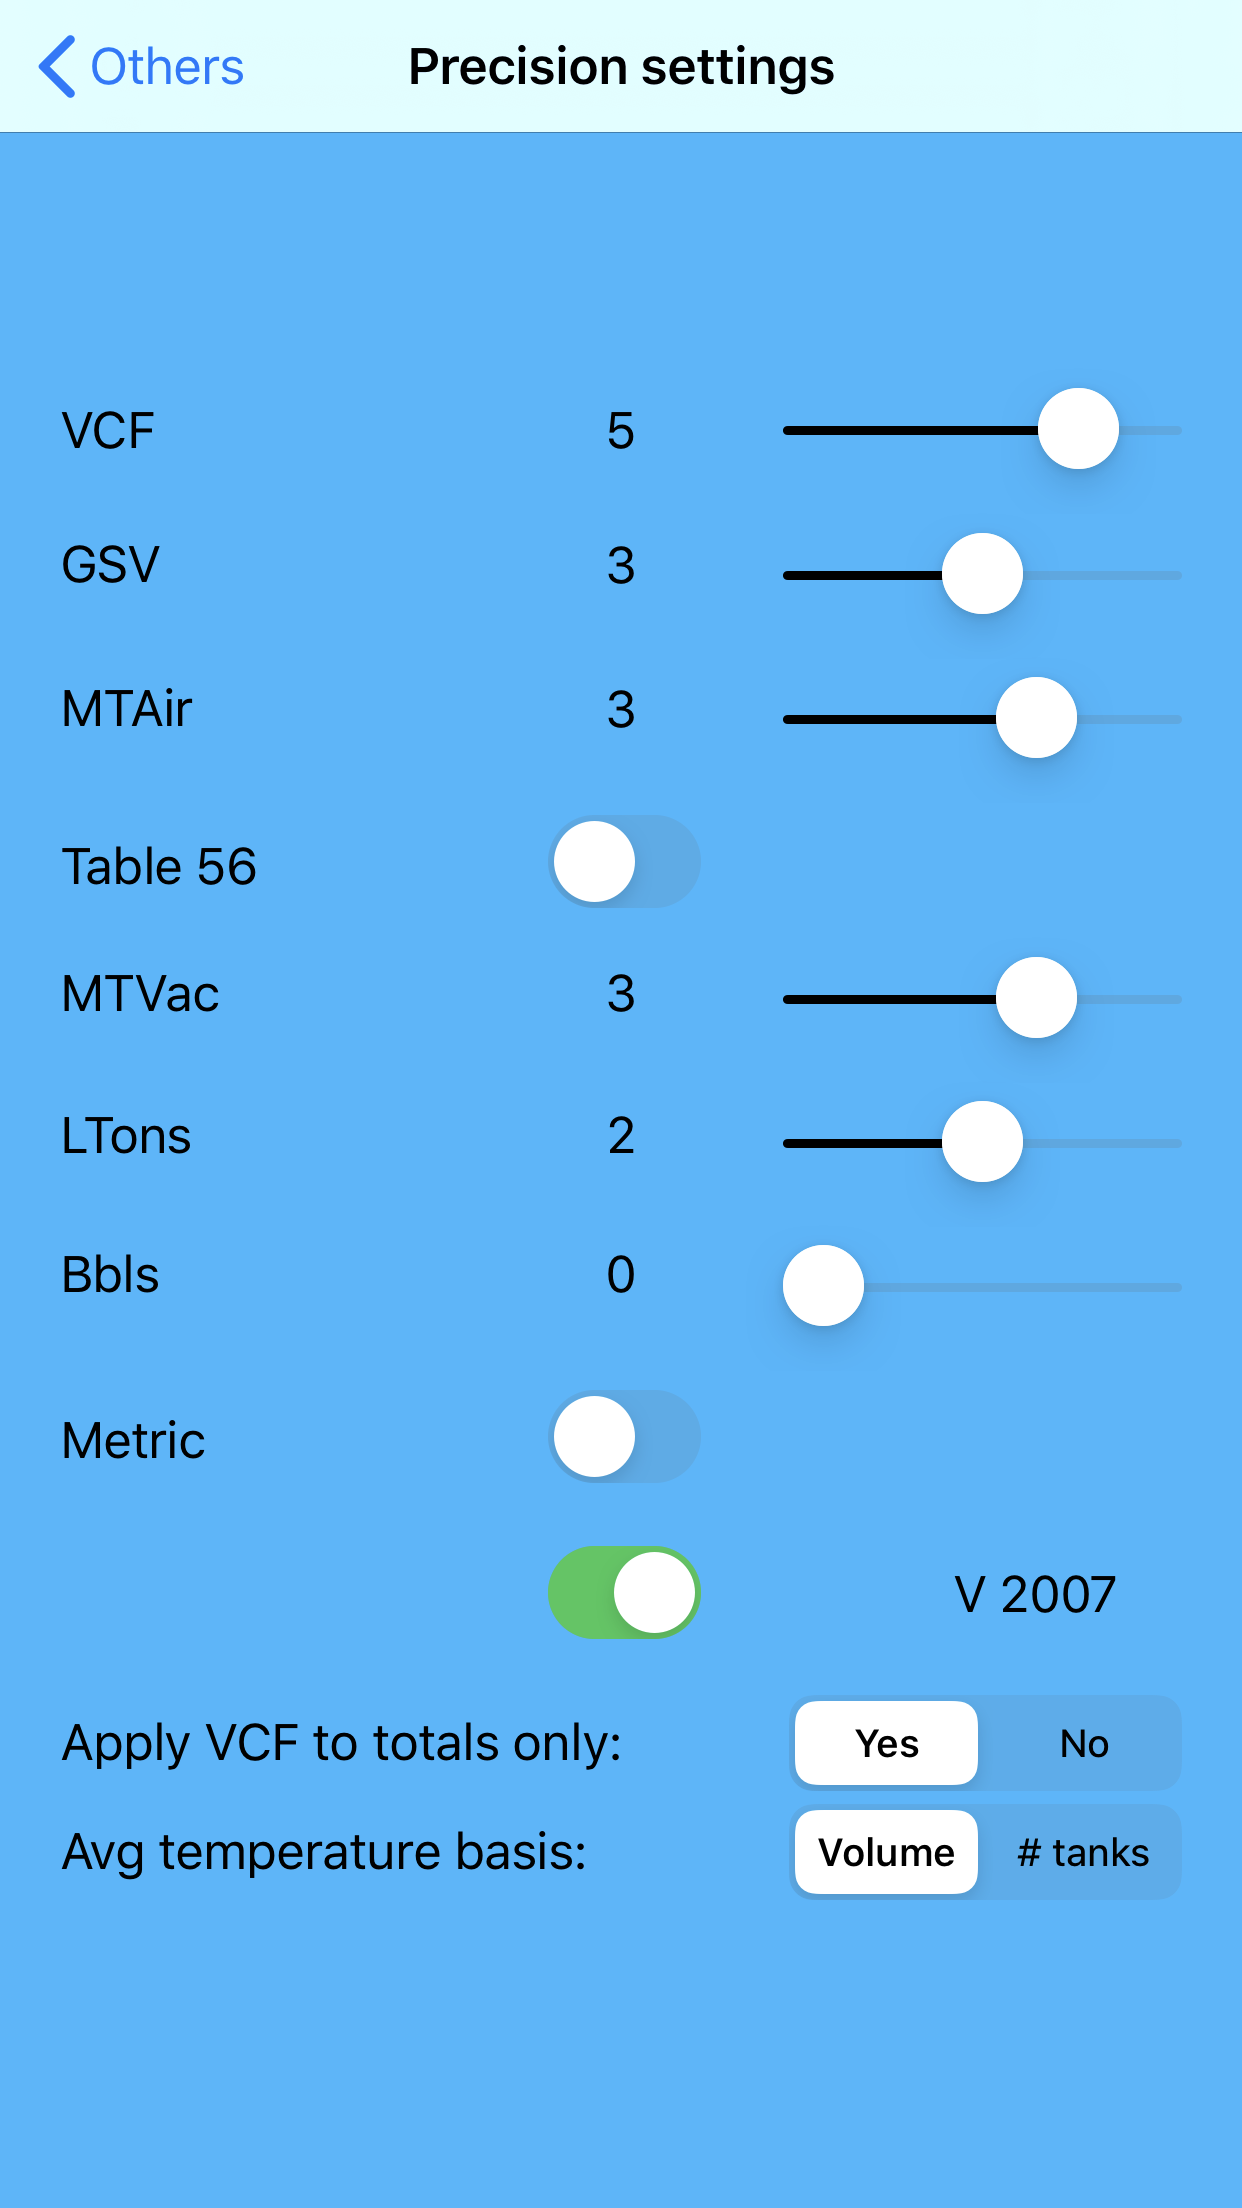
  • First, go to Settings (in the ‘More’ tab), and choose either Metric or Imperial depending on your requirements. For this example, lets go with Metric. When you open the app the first time, the default settings are: Imperial, Tables version 2007, ‘Apply VCF to totals only’ set to No, and ‘Avg temperature basis’ set to Volume, as seen in below screenshot:

Default settings

Default settings

  • Now swipe the switch beside ‘Imperial’ to the left to enable ‘Metric’, and set the switch ‘Apply VCF to totals only’ to yes. This will result in the VCF being calculated only for the total cargo volume, basis the average temperature of the total volume:

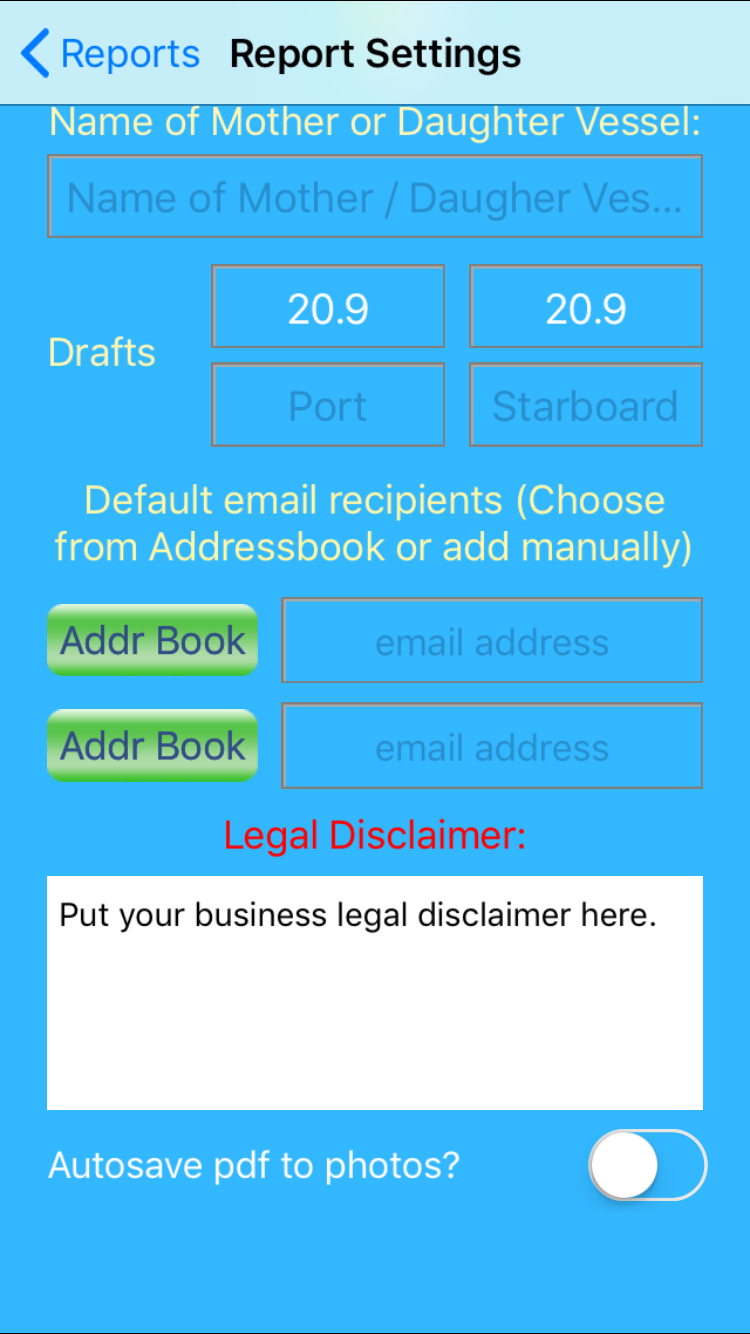
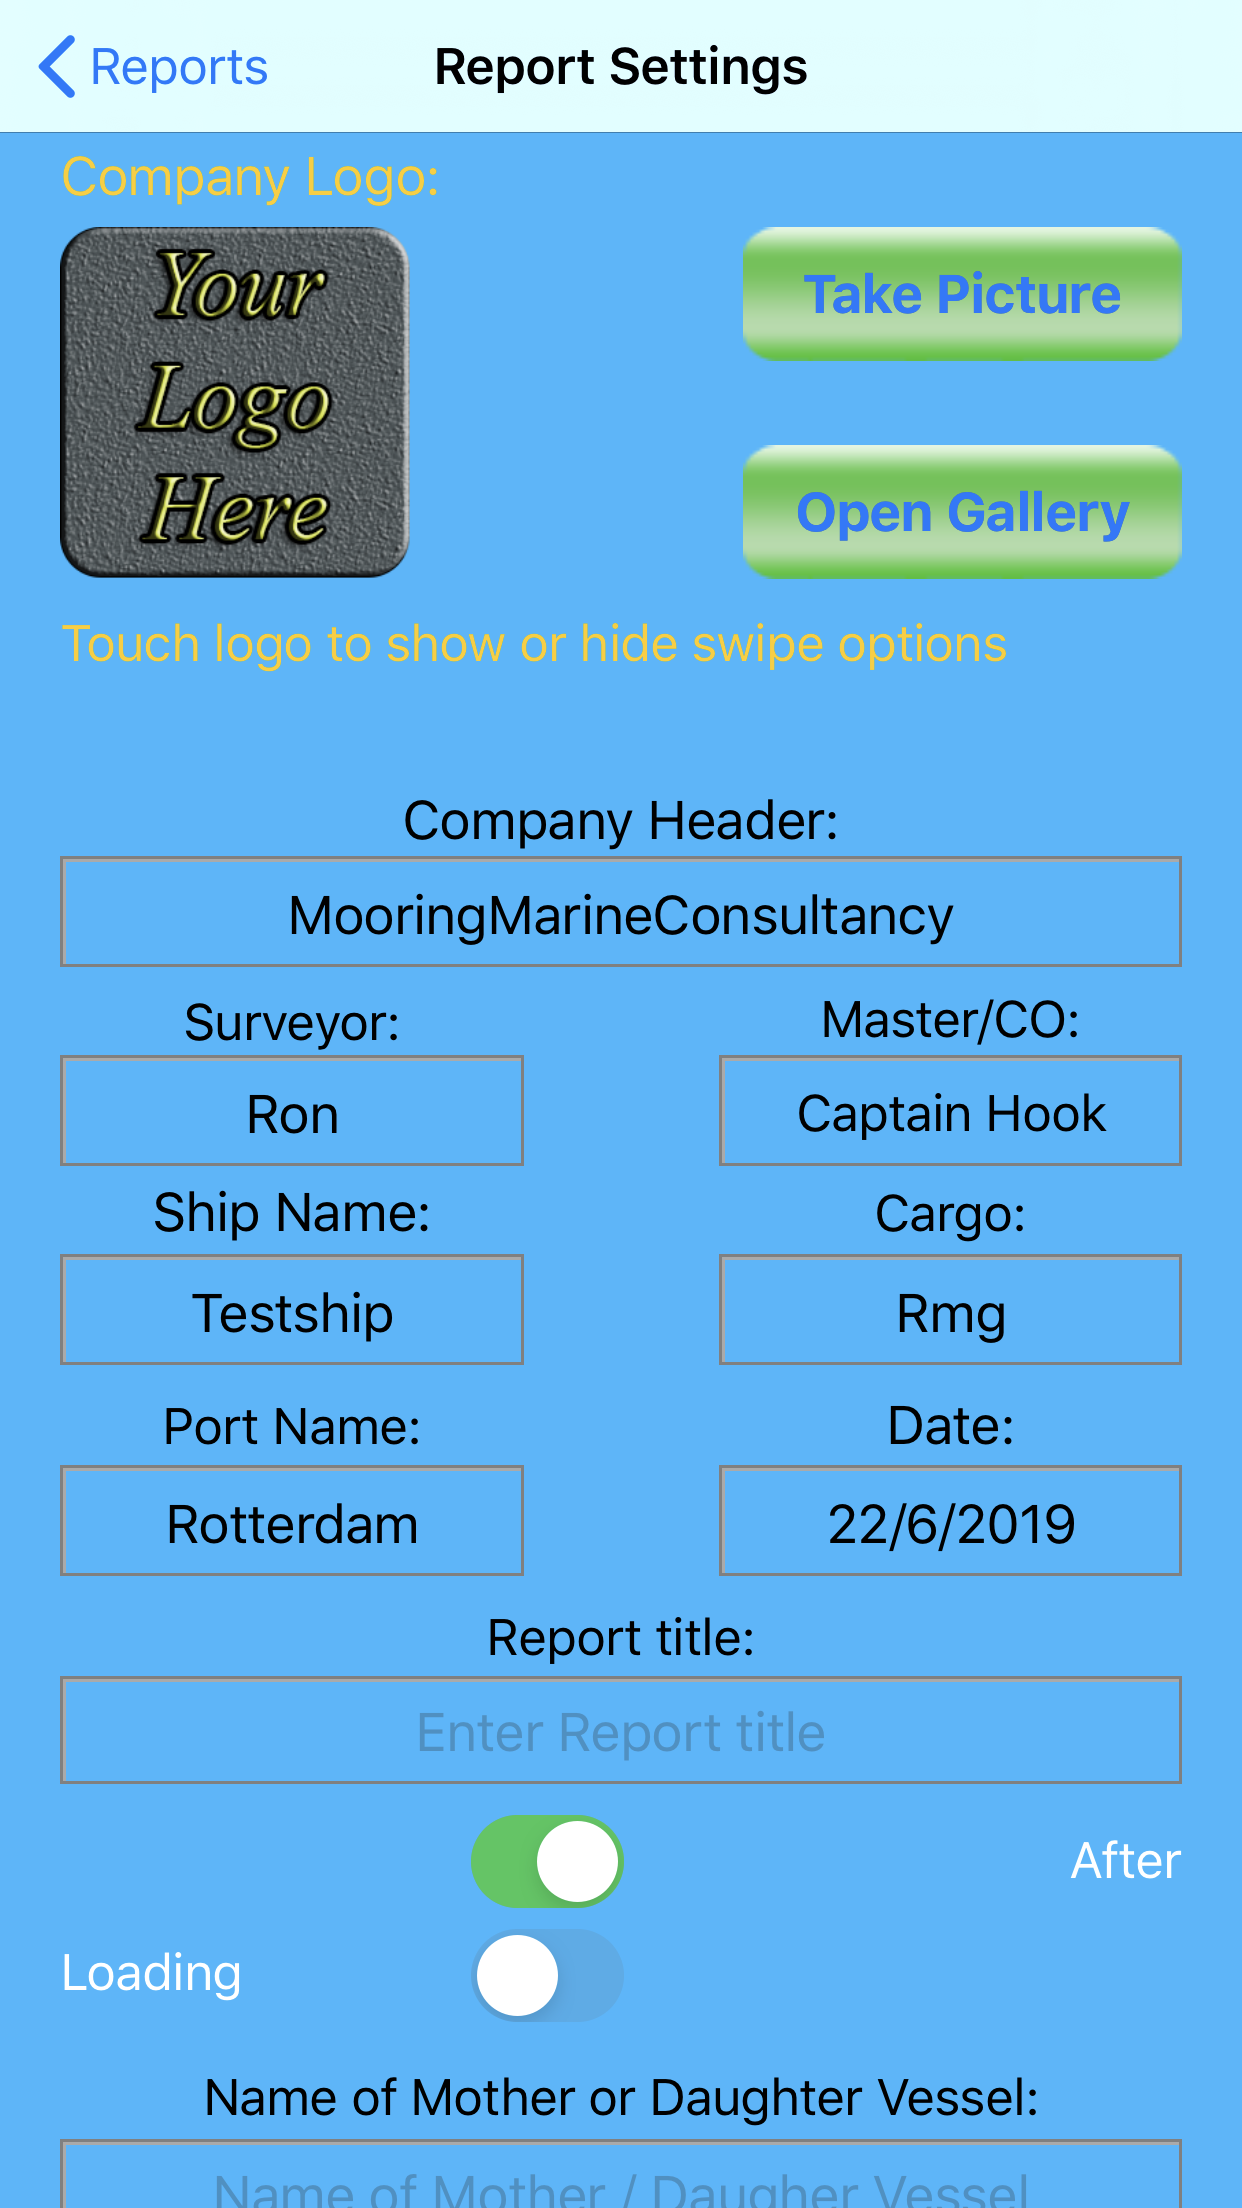
– Next, we go to Report / Report Settings. The first time we open the Report Settings, all fields are empty and units to print are all set to Yes. In the top of the Report Settings page there is an icon ‘Your Logo here’, where you can put your own company logo, or a picture taken with the camera. We can fill in some data such as ship name, date, cargo name, draft etc for the report.

Now if you look at the bottom half of the page you will notice there the switches for MTVac / MTAir / LTons / GSV / Bbls which speak sort of for themselves with the exception of GSV and Bbls: since we have set ‘Apply VCF to totals only’ to Yes (see above screenshot), even if we set the GSV switch to yes in Report Settings, only the total GSV will be printed. If we want GSV to be printed for each tank, we would need to set ‘Apply VCF to totals only’ to No. The Bbls switch includes Gallons as well, so if this switch is set to No, Bbls and Gallons are not printed.

If we have multiple grades within one report and we opt to print all grades in the report, then the total GSV will be printed on the first page, and a breakdown with units for each grades will be printed on the second page. If the GSV switch is set to No, the GSV value(s) will not be printed at all.

There is one more switch regarding GSV: GSVUnits, which can be set to either M³ or Liters (at 15ºC or 60ºF depending on whether you are using Metric or Imperial standards). All the switches described here apply to the printing of ullage reports, but the two switches in the Settings page (as seen in above screenshots) apply also to the Totals page, and to Txfer Reports.

Additionally, there is a switch ‘Print All Cargo tanks incl empty:’. If this switch is set to Yes all tanks on the vessel are printed, regardless of whether they contain any cargo or not. If set to No, only tanks belonging to the selected grade, or in the case of printing all grades only tanks that are not empty are printed. We will set this switch to ‘No’.

Next is the open ‘Add bunkers to Ullage Report’. Set this to Yes, to enable entering bunker details for the ullage report. The bunker details can either be entered manually, or imported from an existing bunker report. Since I am assuming that this is the first time we are running the app, we will enter the bunker data manually. We can set the switch for ‘Bunkers Reported in Units’ to for example MTVac, and we can enter a maximum of 6 tanks, with quantities before and after the cargo operation.

Below the list of tank names, there is a switch ‘Before / After’, which we use to enter both the quantities before and after the operation. The other switch ‘FuelOil / DieselOil’ is only used when we import an existing bunker report, to select either fuel oil tank or diesel oil tank quantities, depending on the cargo grade that is being loaded or discharged:

Now that we have adjusted settings according to our needs, we can go to More / Tank Totals and see how the quantity on our testship tallies. Upon pressing the ‘Tank Totals’ button we are asked to choose either Standard or Selected:

Our test ship has an extended layout, so we press Extended and get presented with a list of available ullage reports:

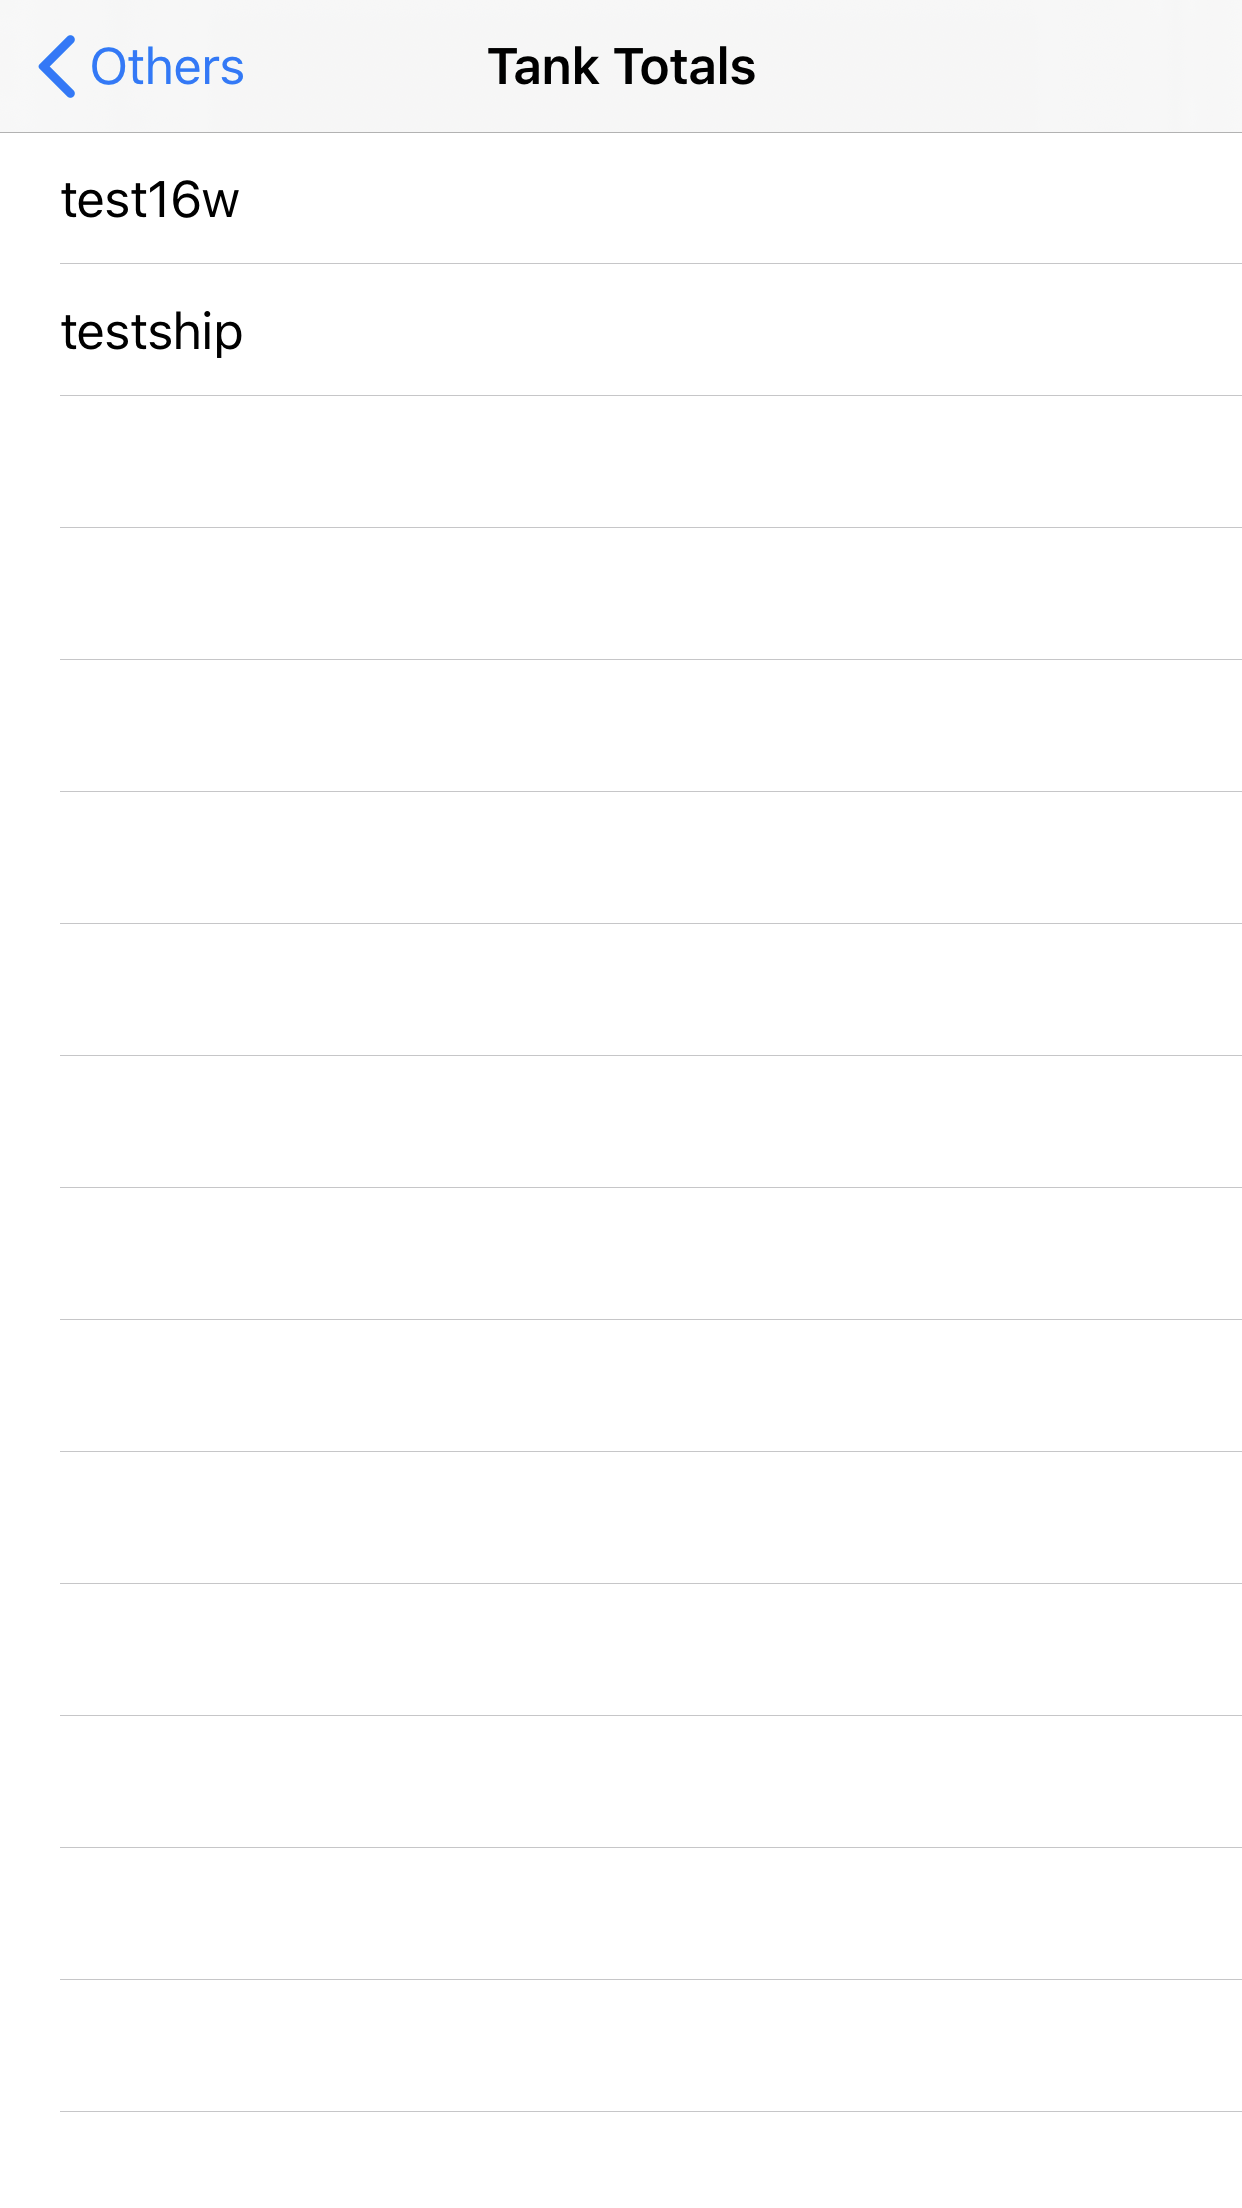
Once we have selected our test ship we get to choose either ‘Rmg’ or ‘Grand Totals’:

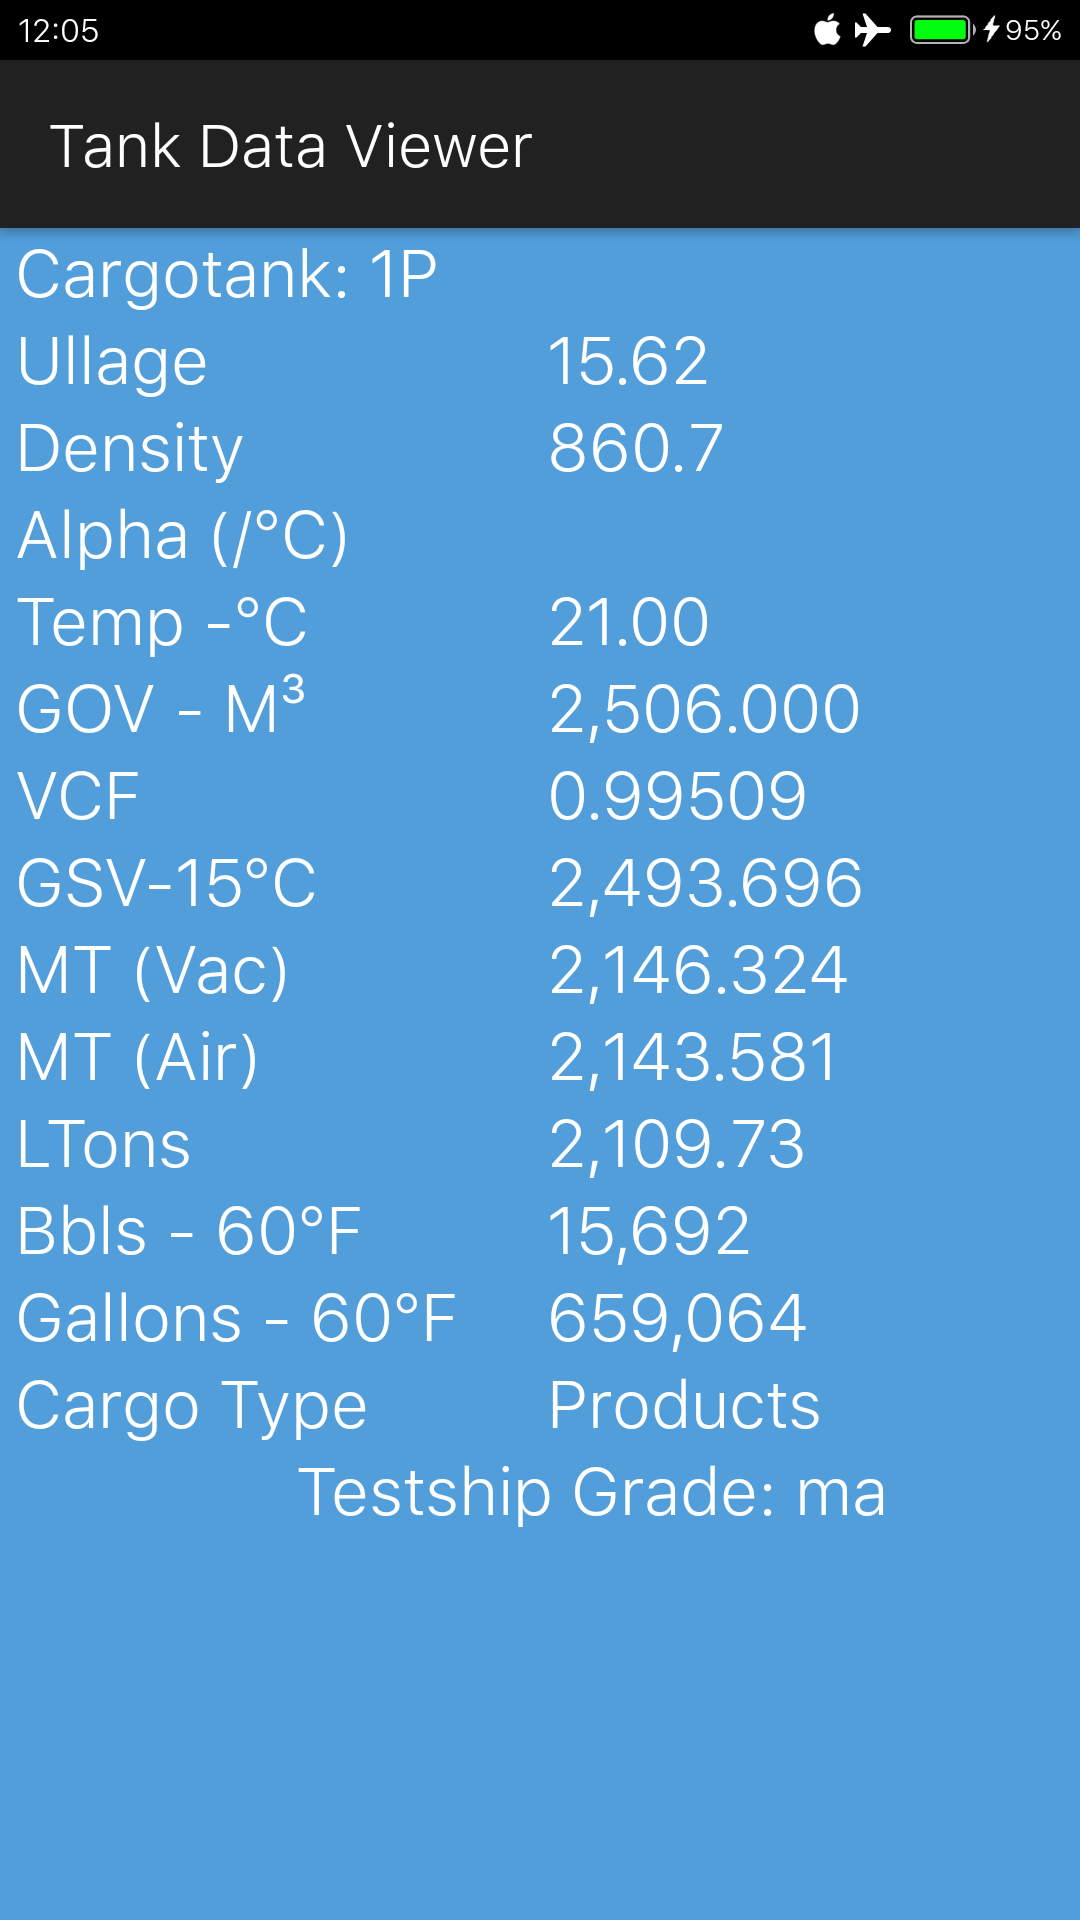
Selecting ‘Grand Totals’ will now result in the following display:

Now lets return to Reports, and select ‘Ullage Reports’. Once again we will be asked to choose either Standard or Extended, so we choose Extended and select our ‘testship’ ullage report, and then we select ‘Totals’ when asked to select a grade:

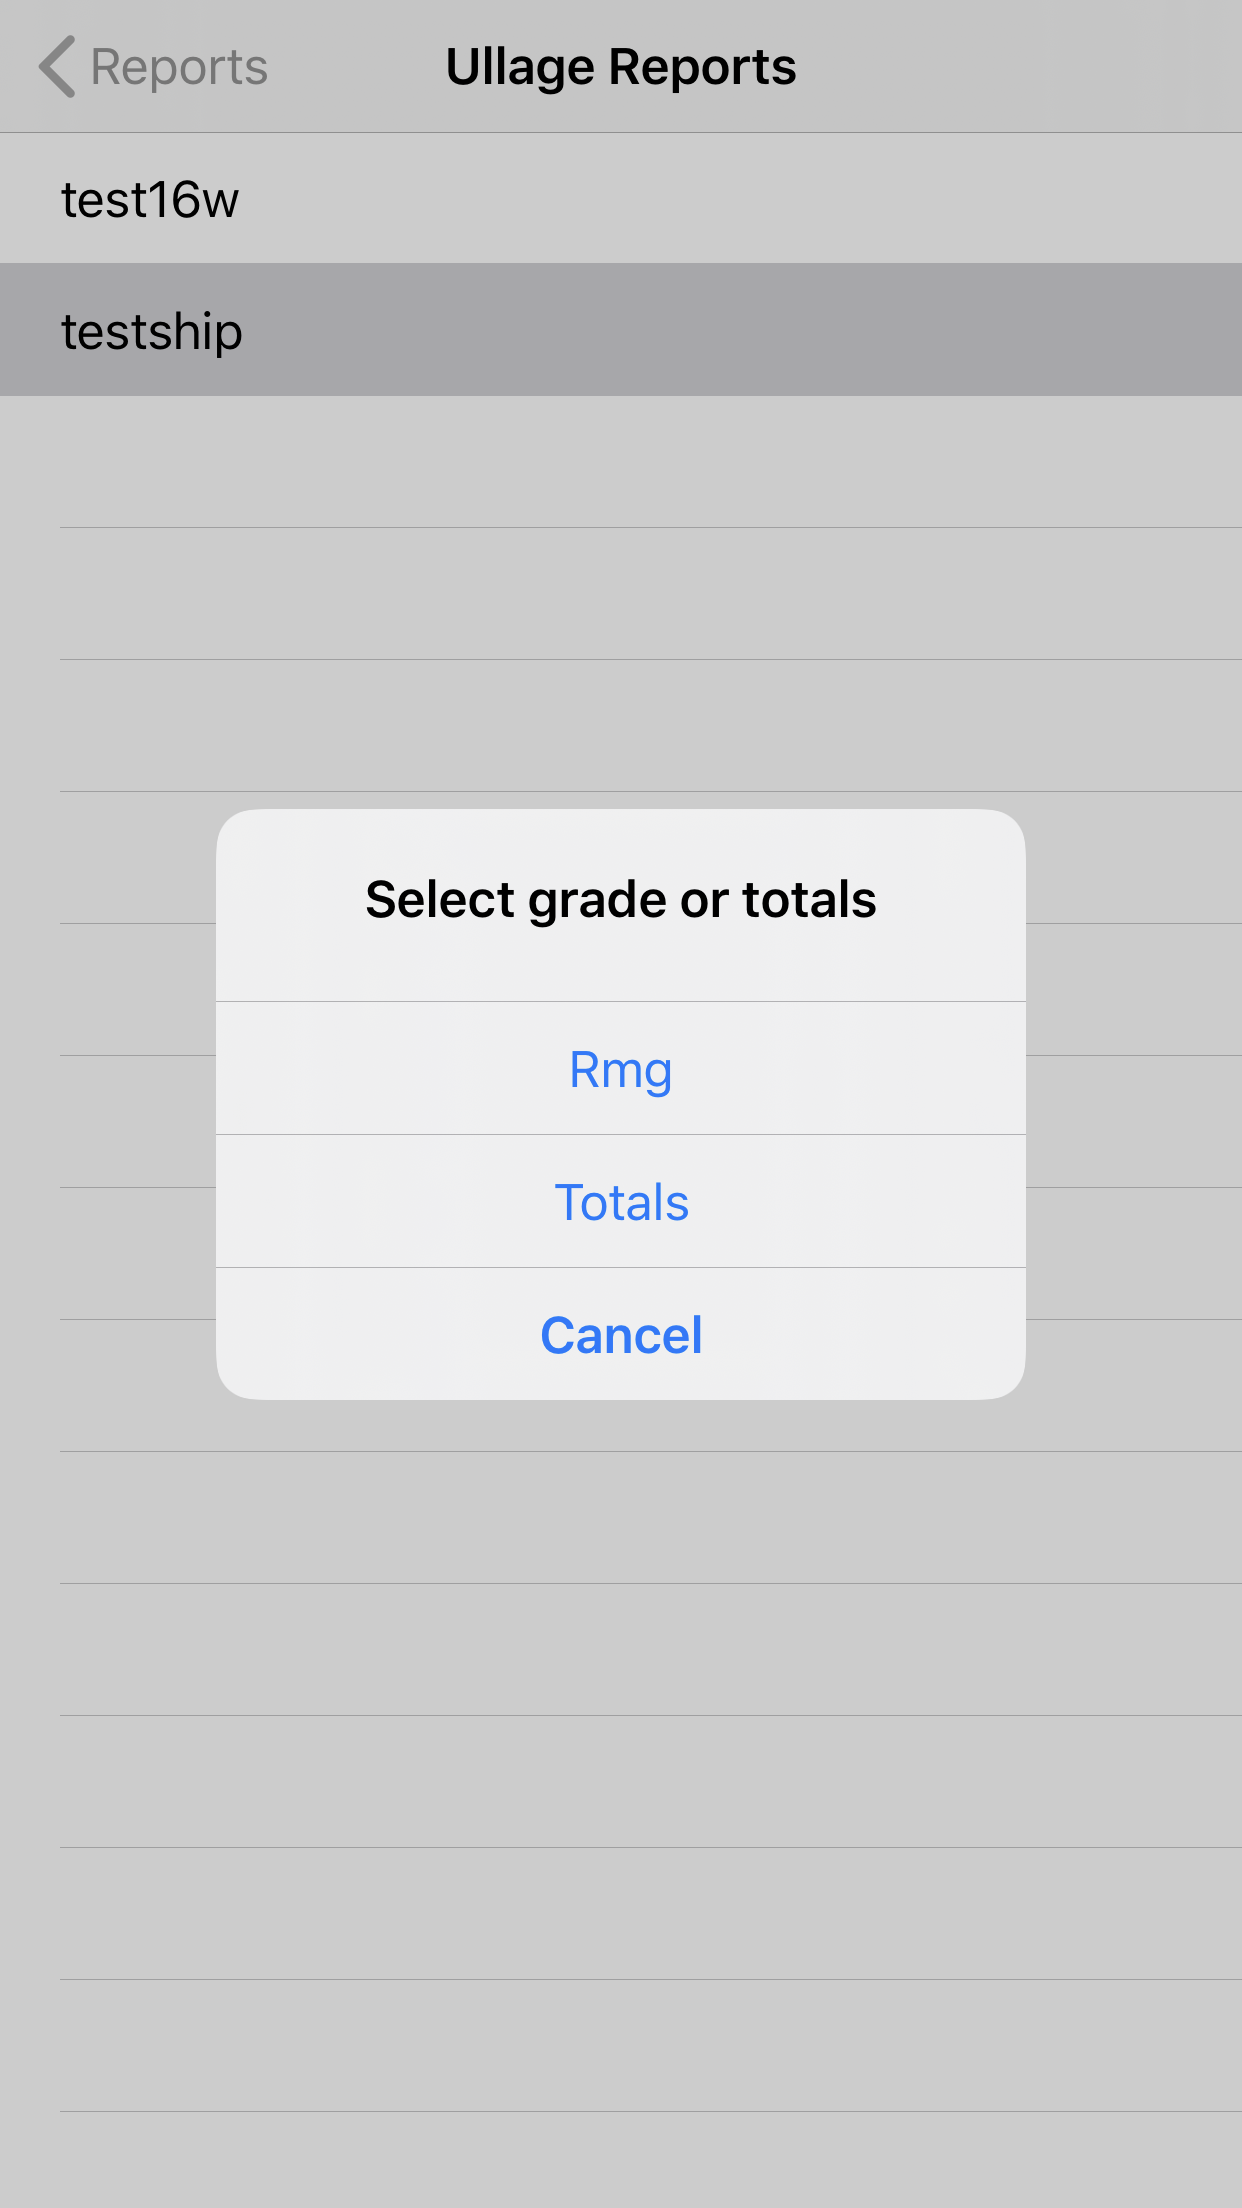
Finally, we are presented with our ullage report. Upon the report being printed, we are asked if we want to email the report:

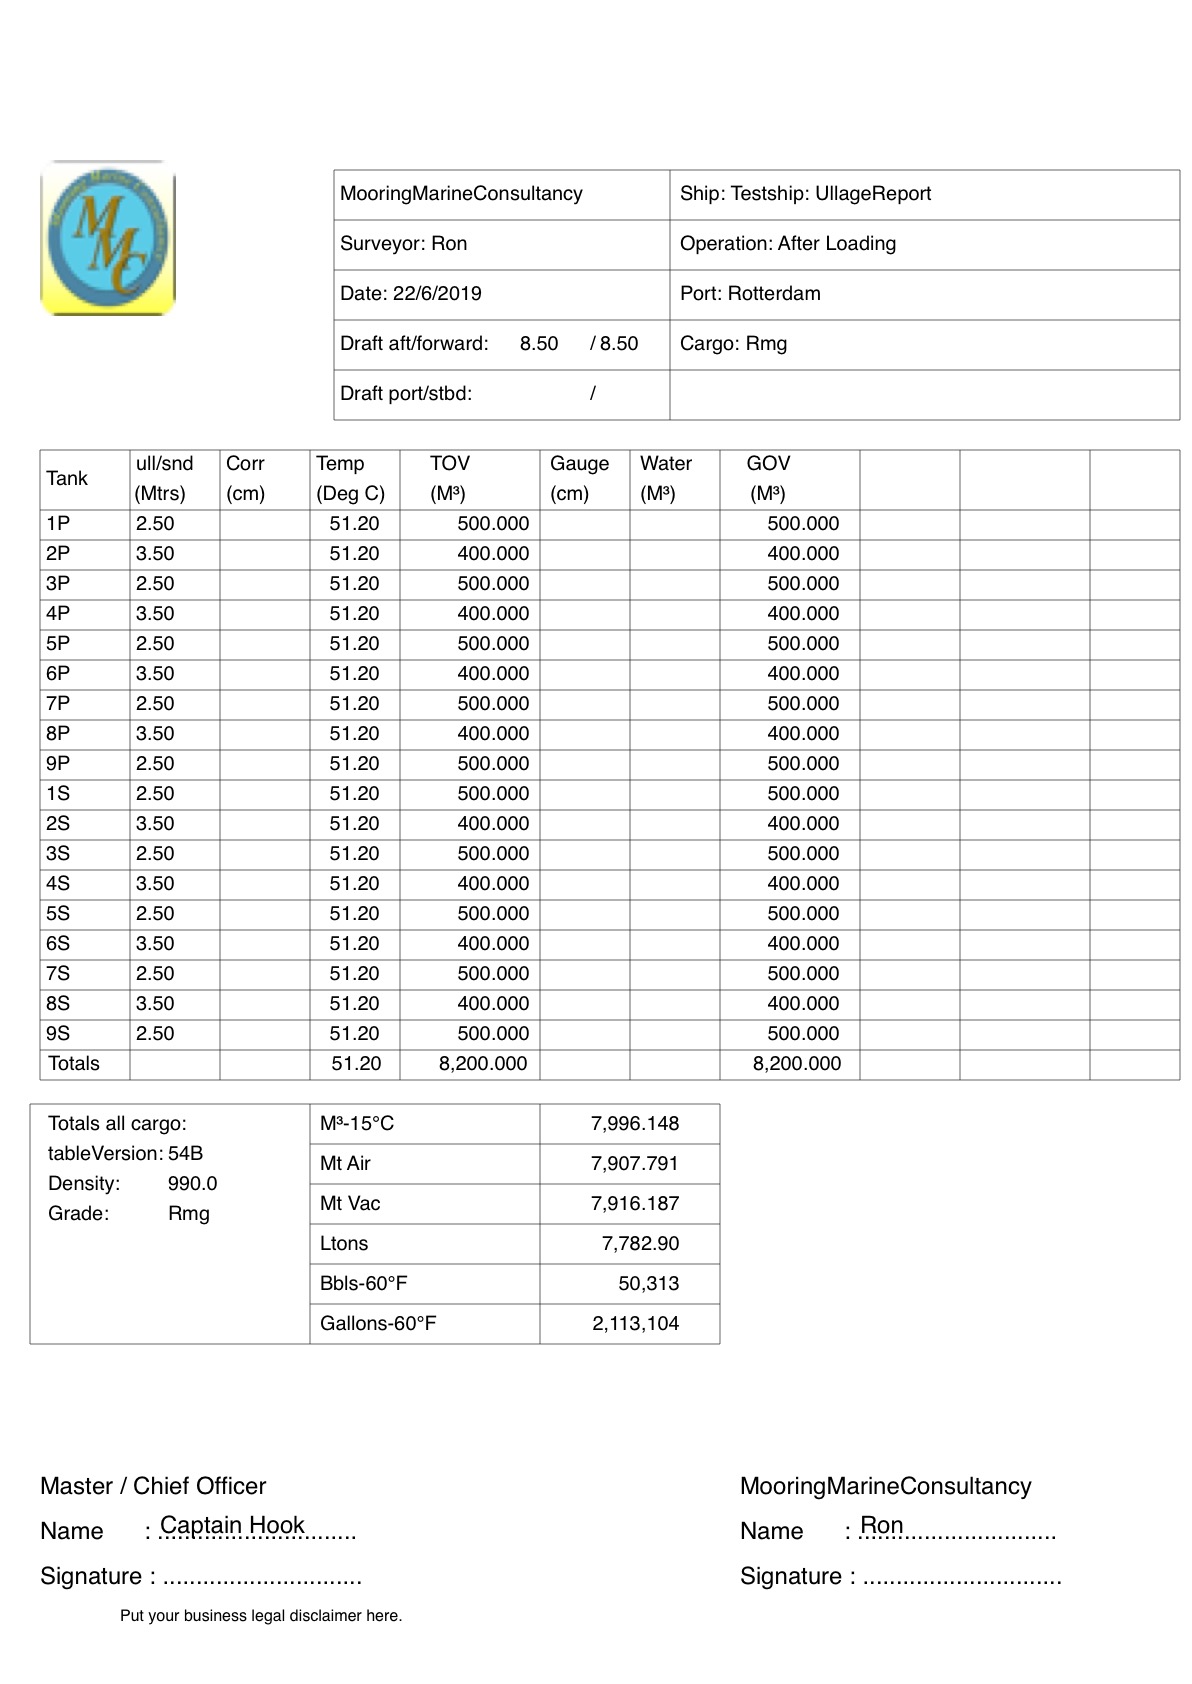
If we press ‘OK’, the mail application will pop up, with the report attached as a pdf. Within Report Settings we can actually configure email addresses that are automatically set as recipients, or you can manually enter TO addresses. If we press ‘NO’ we are asked if we want to export the report to csv (Comma Separated Value) and we will also be asked if we want to email the exported file. This is all explained in detail in the user manual, which can also be downloaded from this blog. Below the two pages of the actual report:


Because we selected ‘Totals’, the density is also printed for each tank. If we had chosen to print only ‘Rmg’, then the density would only be printed in the box with ‘Totals all cargo’, below the table version.

Below the ullage report if we select to print ‘Rmg’, with the ‘Add bunkers to Ullage Report’ set to No, and our Logo set to MMC. The density is now only printed in the ‘Totals all cargo’ box:

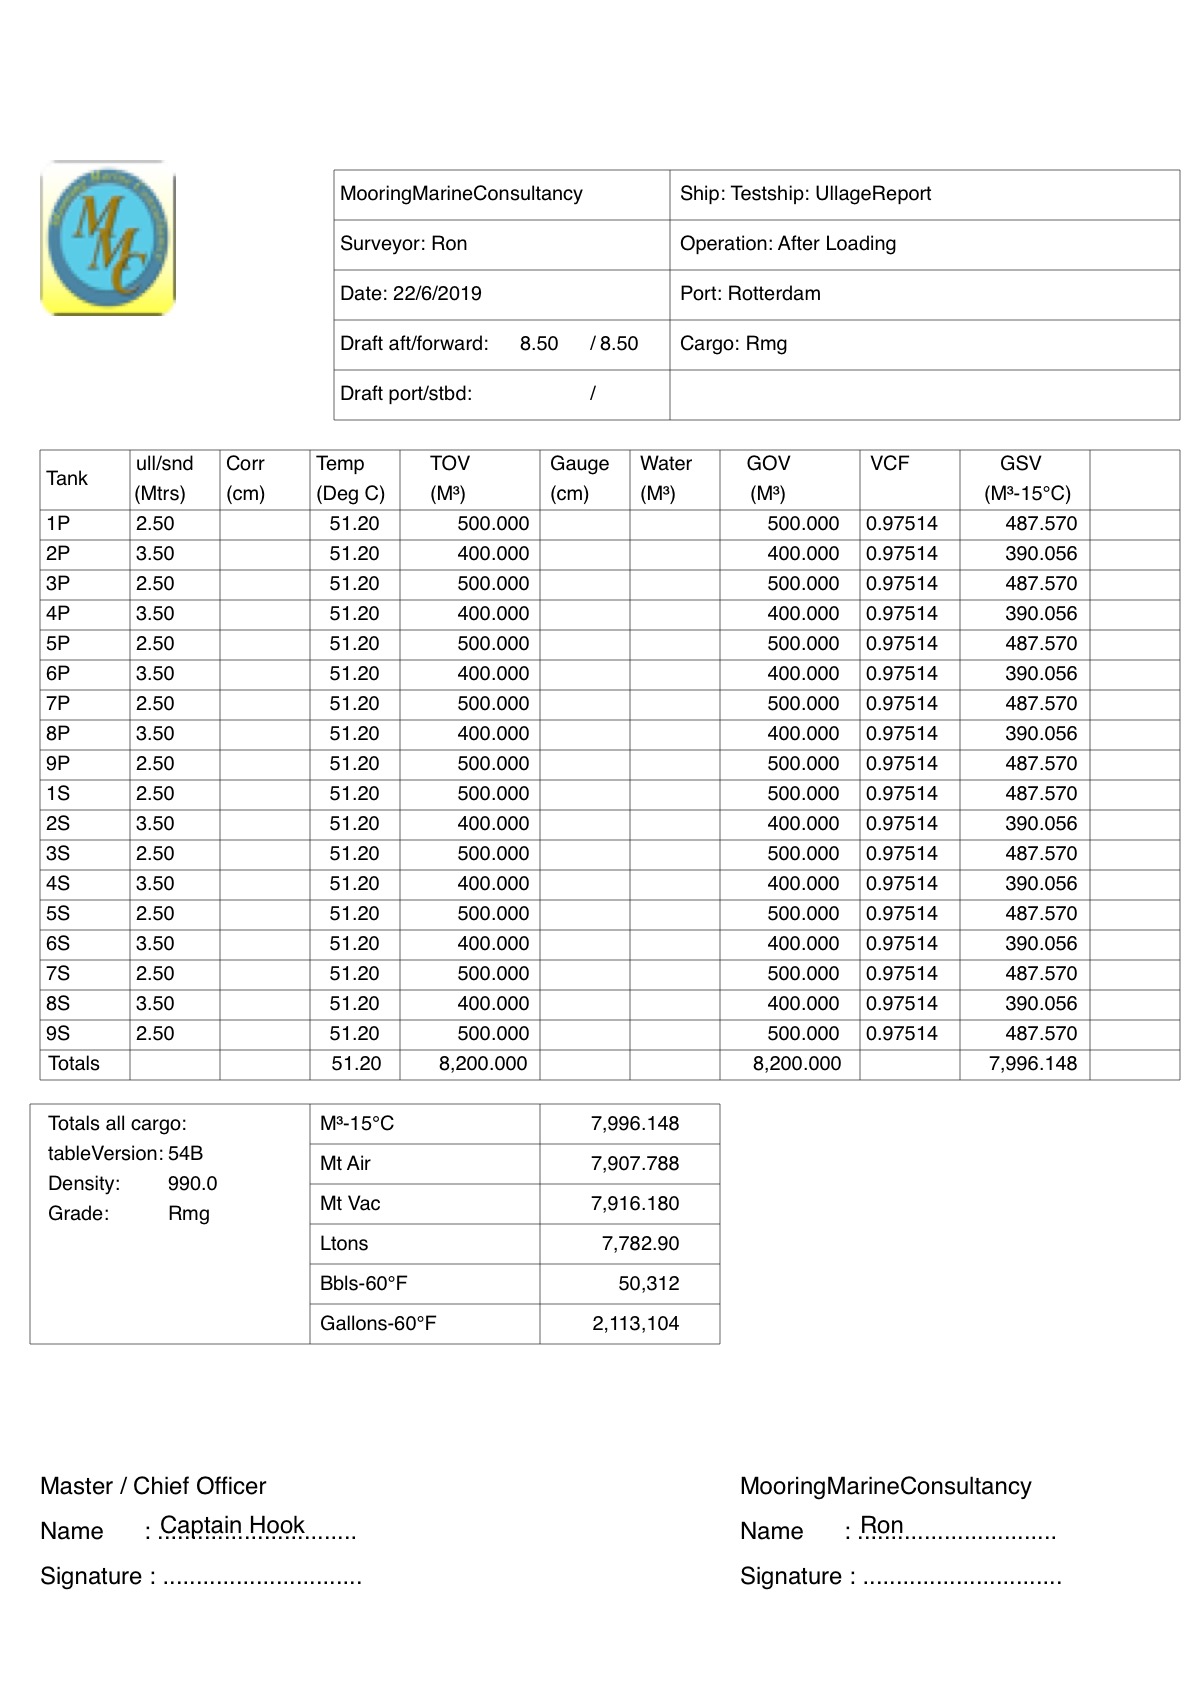
If the client requires the VCF to be printed for all tanks, then we must set ‘Apply VCF to totals only’ to No on the Settings page. In that case VCF for all individual tanks will be printed, provided that we have set the GSV switch to Yes in the Report Settings page:

In the bottom of the first three report pages above, you can see the text ‘Put your business legal disclaimer here’; this is another setting in Report Settings, in the upper part. Whatever text you enter there will be saved in the app’s local settings and remain there until you change it. If you have not entered your own customized disclaimer, the app warns you of that when you exit the Report Settings page. The warning can be disabled by selecting ‘Do not show again’. If you set the disclaimer text to empty, no disclaimer will be printed at all.

Details of all settings can be found in the user manual, as mentioned earlier. This completes the Ullage Reports 101 tutorial. In a future tutorial we will discuss the updated version of the transfer / executive summary report.

Stay safe and keep watching this space!

download in the appstoreCargoSurveyor for iPhone can be downloaded here.

Major Update for CargoSurveyor Tools for iOS is out!

Today we published the latest version of Cargo Surveyor Tools for iOS, version 1.6.2.

This update comes with a slate of improvements such as bug fixes for most of the scroll views and better keyboard handling, and new features, such as the ability to export / import bunker reports, ullage reports, time sheets and VEF reports, as well as various new settings for deciding which units need to be printed on an ullage report, and for example the option to display bunker figures before and after the cargo operation on the ullage report.

A new user manual reflecting all changes and additions has been compiled (CargoSurveyor iOS user manual version 1.6.2) which can be download from this blog on the page ‘User manuals for oil calculators and other apps’, the link can be found in the top of this page as well.

The exported reports can be imported directly into Excel and with a simple help sheet the user would be able to convert the imported data into a proper excel ullage report, bunker report or VEF report.

Ever since iOS 7, previous versions of the app had problems with scrolling in larger screens in particular when editing data in text fields. Finally most of these problems have been fixed and the user can enter data in the various text fields without the text fields disappearing from view.

In the Settings screen, two options have been added:

  • The option to calculate the VCF for each tank, or to calculate the VCF for the totals of all tanks in one grade only

  • The option to calculate the average temperature basis total cargo volume, or basis the number of tanks in use

In the Report Settings screen, the following options have been added:

  • The option to print all tanks, empty or not, or only print tanks that have cargo

  • The option to include a bunker statement in the ullage report

  • The option to set the unit used for the bunker statement as Liters / M³ / MTAir / MTVac /LTons / Bbls

  • The option to print GSV in Liters or M³

  • The option to print or not, for all units individually: MTVac, MTAir, LTons, GSV, Bbls

  • When importing an existing bunker report, the option to either use Fuel or Diesel Oil data

As a reminder of the features of this app, the toolbox contains (among others) the following items:

1: Fully configurable ullage forms:

In the new version, the first screen in the ‘Tanks’ tab gives the user a choice between ‘Standard’ and ‘Extended’ layout:

Choose standard or extended

Main entry screen

When selecting ‘Standard’, the user can choose from a minimum set of 5 wing tanks plus two slop tanks, to a maximum set of 7 crosses plus two slop tanks, as well as three bottom lines, a total of 26 entries:

Configure number of tanks

Configure number of tanks

When selecting ‘Extended’, the user can choose from a minimum of 8 center tanks and a maximum set of 16 crosses plus two slop tanks, as well as three bottom lines, a total of 53 entries:

Extended layout

Extended Layout Configuration

Once a configuration has been selected (in the Standard configuration) or entered (in the Extended configuration), the tank editor screen is presented. The tank editor screen is the same for any configuration, regardless of whether standard or extended:

Tank editor using extended layout

Tank editor using extended layout

A new button has been added to the tank editor, ‘Quickfill’: this allows the user to fill in values for ullage / temperature / water / density / oil volume / alpha and grade name for all tanks or a group of tanks in one single action. This option is handy in case of for example loading a ship with one single grade, where grade name and density for all tanks are the same. The quick fill button is only enabled when the first tank is selected. The values entered can be applied to:

  • all wing tanks
  • all center tanks
  • odd numbered tanks
  • even numbered tanks
  • all port side tanks
  • all starboard side tanks
  • all tanks
quick fill option

Quick fill option

Regardless of the program’s main settings, ullages /temperatures/densities/volumes can be entered in either SI Metric or Imperial units. In the same report both Metric and Imperial units can be mixed, the app will automatically convert to the right units during processing.

When the time comes to save/print or email the report, the user can choose whether to use SI Metric or Imperial units, regardless of which units have been used during the creation of the report. An unlimited number of ullage reports can be saved, and existing reports can be cloned in order to create different reports for the same ship (i.e before and after discharging etc).

The report in pdf format can be send as an email attachment from within the app, and can also be saved automatically as a png file to the camera roll. If required, both the png file and the pdf file can then be transferred to a desktop computer for printing.

In the Report Settings the user can choose whether reports should automatically be saved to the camera roll or not. For Ullage Reports, Bunker Reports, VEF Reports and Time Sheets the report can be exported to a csv (Comma Separated Value) file, which can also be sent as an email attachment from within the app.

2: Fully configurable time sheet editor:

The time sheet editor comes with a whole bunch of standard entries but has ample room for new entries as required by the user. Events can be entered into the editor in any order, the app will automatically sort all entries by date and time. An unlimited number of time sheets can be saved, one for each ship and/or event as desired. Like the ullage report, the time sheet can be send as an email attachment from within the app, and can be saved to the camera roll for transferring to a computer:

Time sheet standard entries

Time sheet standard entries

iOS Simulator Screen shot Oct 31, 2014 6.22.47 PM

Time sheet details editor

3: Configurable wedge calculator:

The app contains a wedge calculator with the following features:

– calculate wedge volume based on ship/tank dimensions

– calculate wedge volume based on tank calibration table volume

– calculate wedge volume using either Metric or Imperial units

Entries made are automatically saved and restored the next time the user opens the wedge calculator.

Wedge volume using tank dimensions

Wedge volume using tank dimensions

Wedge volume using tank table volume

Wedge volume using tank table volume

4: Instant tank totals view per grade, or for all grades together:

After creating an ullage sheet and filling in a grade name, temperature, volume and density (or API) for each tank, the user can view the tank totals, either per grade or the grand totals. The totals screen will give the totals of observed volume, gross standard volume, metric tons etc, as well as the physical average temperature of the cargo.

List of available grades

List of available grades

Totals - Imperial units

Totals – Imperial units

Totals - Metric units

Totals – Metric units

Again regardless of what units have been used in the ullage report, the totals can be viewed in either Metric or Imperial units by choosing the desired unit in general settings.

5: Detail view for each tank after entering data:

After entering data in the tank details editor, all data can be viewed for each tank in the Layout configurator screen, using the buttons to select either a tank or a bottom line (in the standard layout configurator), or select a tank using the picker view (in the extended layout configurator):

all details viewer

Details of tank 4P

Configure number of tanks

Select tank using buttons

Extended configurator

Select tank using picker

6: Ullage reports are now much more configurable:

With Report Settings, the user can select whether to print or not:

  • MTVac
  • MTAir
  • LTons
  • GSV
  • Bbls/Gallons

Also, empty tanks can either be included in the report, or omitted. The GSV can be printed as either Liters at 15°C/60°F or M³. Also, if in General Settings ‘Apply VCF to totals only’ is set to Yes, GSV is only printed for totals, not for individual tanks.

Additionally, bunker quantities before and after the cargo operation can be added to the ullage report by setting ‘Add bunkers to Ullage Report’ has been set to Yes in Report Settings. These bunker quantities can either be entered manually, or imported from an existing bunker report.

The user can set the bunker quantity units to either Liters / M³ / MTAir / MTVac / LTons / Bbls.

Settings: in the ‘more’ screen the user has access to a settings panel, where there are options to:

General Settings

New options in General Settings

– chose ASTM tables 1980 or 2004

– chose SI Metric or Imperial units and methods (i.e. whether to use table  6A or 54A for example)

– chose whether to calculate metric tons in air using table 56 or using  density(vac) – 11 points

– set the precision for vcf, gsv, metric tons etc

– Apply VCF to totals only using the average cargo temperature

– Calculate the average temperature (for all tanks or for a grade) basis the total cargo volume, or basis the number of tanks

Aside from the above, the app contains a complete set of forms as  required by marine cargo surveyors:

– Customizable report settings, including company logo, standard email recipients, report titles etc

Report settings part 1

Report settings top part

Report settings (bottom part)

Report settings (center part)

Report Settings bottom part

Report Settings bottom part

 – Transfer summary (for vessel) and executive transfer summary (for the client)

New entries have been added to the transfer summary:

– VEF for own ship in case of STS

– VEF for daughter vessel in case of STS

– Bill of Lading date in case of loading operation

In case of STS operations, a VEF corrected comparison is now also included with the executive summary.

All other reports remain as they were, but one more addition is the ability to export and import the following reports as csv (comma separated value) files:

– Ullage report

– Bunker report

– VEF report

– Time Sheet

These reports can be viewed or imported into Excel. Exported reports are copied into the phone’s documents folder, and during exporting, the user gets the option to email the exported file as well.

We’re going to publish several articles with more detail concerning the new features in CargoSurveyor in the coming days, so keep watching this space!

download in the appstoreCargoSurveyor for iPhone can be downloaded here.

We should like to advise everyone who has downloaded the app in the past to update as soon as possible to ensure a flawless CargoSurveyor experience.

CargoSurveyor Tools for iOS Version 1.5.9 is out!

After a long period of silence on the Apple side of development, we are updating our existing iphone apps to the latest iphone version, iOS 13.2.

Today (5th January 2020) version 1.5.9 of CargoSurveyor Tools for iOS was published.

This update was published in order to make the app available on iOS 13, and is available for any iPhone that has iOS 10.2 or higher installed. For older devices, version 1.4.1 remains available on the App Store (for the time being, depending on when Apple decides to change their requirements again).

Previous version of the app had problems with scrolling in larger screens in particular when editing data in text fields. Although this problem has not entirely been fixed, it is possible to see each textfield before and after entering data.

Newer devices, using iOS 13.0 and up can make use of dark mode, which is enabled in many of the screens:

Add grade names

Add grade names


Enter volumes of line sections

Enter volumes of line sections

Select a grade for each tank

Select a grade for each tank

Pre cargo matrix tool (top)

Pre cargo matrix tool (top)

Pre cargo matrix (bottom part)

Pre cargo matrix (bottom part)

One change has been made to the Ship Particulars tab: users can now enter details directly in the table view, without having to switch to the detail view first, for improved convenience, as shown below:


As a reminder of the features of this app, the toolbox contains (among others) the following items:

1: Fully configurable ullage form:

The user can choose the number of tanks, from a minimum set of 5 wing tanks plus two slop tanks, to a maximum set of 7 crosses plus two slop tanks, as well as three bottom lines:

Configure number of tanks

Configure number of tanks

Regardless of the program’s main settings, ullages /temperatures/densities/volumes can be entered in either SI Metric or Imperial units. In the same report both Metric and Imperial units can be mixed, the app will automatically convert to the right units during processing.

When the time comes to save/print or email the report, the user can choose whether to use SI Metric or Imperial units, regardless of which units have been used during the creation of the report. An unlimited number of ullage reports can be saved, and existing reports can be cloned in order to create different reports for the same ship (i.e before and after discharging etc).

The report in pdf format can be send as an email attachment from within the app, and can also be saved as a png file to the camera roll. If required, both the png file and the pdf file can then be transferred to a desktop computer for printing. In the report settings the user can choose whether reports should automatically be saved to the camera roll or not. In the previous version a dialog window would show up asking the user whether the file should be saved to the camera roll or not, every time a report is generated.

2: Fully configurable time sheet editor:

The time sheet editor comes with a whole bunch of standard entries but has ample room for new entries as required by the user. Events can be entered into the editor in any order, the app will automatically sort all entries by date and time. An unlimited number of time sheets can be saved, one for each ship and/or event as desired. Like the ullage report, the time sheet can be send as an email attachment from within the app, and can be saved to the camera roll for transferring to a computer:

Time sheet standard entries

Time sheet standard entries

iOS Simulator Screen shot Oct 31, 2014 6.22.47 PM

Time sheet details editor

3: Configurable wedge calculator:

The app contains a wedge calculator with the following features:

– calculate wedge volume based on ship/tank dimensions

– calculate wedge volume based on tank calibration table volume

– calculate wedge volume using either Metric or Imperial units

Entries made are automatically saved and restored the next time the user opens the wedge calculator.

Wedge volume using tank dimensions

Wedge volume using tank dimensions

Wedge volume using tank table volume

Wedge volume using tank table volume

4: Instant tank totals view per grade, or for all grades together:

After creating an ullage sheet and filling in a grade name, temperature, volume and density (or API) for each tank, the user can view the tank totals, either per grade or the grand totals. The totals screen will give the totals of observed volume, gross standard volume, metric tons etc, as well as the physical average temperature of the cargo.

List of available grades

List of available grades

Totals - Imperial units

Totals – Imperial units

Totals - Metric units

Totals – Metric units

Again regardless of what units have been used in the ullage report, the totals can be viewed in either Metric or Imperial units by choosing the desired unit in general settings.

 5: Detail view for each tank after entering data:

After entering data in the tank details editor, all data can be viewed for each tank in the first screen, using the buttons to select either a tank or a bottom line:

all details viewer

Details of tank 4P

Configure number of tanks

Configure number of tanks

Settings: in the ‘more’ screen the user has access to a settings panel, where there are options to:

general settings

– chose ASTM tables 1980 or 2004

– chose SI Metric or Imperial units and methods (i.e. whether to use table  6A or 54A for example)

– chose whether to calculate metric tons in air using table 56 or using  density(vac) – 11 points

– set the precision for vcf, gsv, metric tons etc


Aside from all the above, the app contains a complete set of forms as  required by marine cargo surveyors:

– Customizable report settings, including company logo, standard email recipients, report titles etc

Report settings part 1

Report settings part 1

Report settings (bottom part)

Report settings (bottom part)

 – Transfer summary (for vessel) and executive transfer summary (for the client)

Transfer summary editor (partial view)

Transfer summary editor (partial view)

transfer summary 2nd part (partial view)

transfer summary 2nd part (partial view)

transfer summary simple view

transfer summary simple view

transfer summary pdf for client

transfer summary pdf for client

– Pumping log

Pumping log editor (partial view)

Pumping log editor (partial view)

pumping log - lower half

pumping log – lower half

Pumping log report

Pumping log report

– OBQ / ROB report

OBQ/ROB report part1

OBQ/ROB report part1

OBQ/ROB report part2

OBQ/ROB report part2

OBQ/ROB report pdf

OBQ/ROB report pdf

– Slop report

Slop report part 1

Slop report part 1

Slop report part 2

Slop report part 2

Slop report pdf

Slop report pdf

– Reference heights and raw measurements report

Ref heights report part 1

Ref heights report part 1

Ref heights report part 2

Ref heights report part 2

Ref heights report pdf

Ref heights report pdf

– Bunker report

Bunker report part 1

Bunker report part 1

Bunker report part 2

Bunker report part 2

Bunker report pdf

Bunker report pdf

– VEF report

VEF report part 1

VEF report part 1

VEF report part 2

VEF report part 2

VEF report pdf

VEF report pdf

– Preloading report

Preloading report part 1

Preloading report part 1

Preloading report part 2

Preloading report part 2

Preloading report part 3

Preloading report part 3

Preloading report pdf

Preloading report pdf

– Sampling report

Sampling report part 1

Sampling report part 1

Sampling report part 2

Sampling report part 2

Sampling report pdf

Sampling report pdf

– Standard protest letters (such as ship/shore diff, ship fig/BL diff, in transit diff)

Notice of apparent discrepance example part 1

Notice of apparent discrepancy example part 1

Notice of apparent discrepance example part 2

Notice of apparent discrepancy example part 2

Notice of apparent discrepance example pdf

Notice of apparent discrepancy example pdf

– Standard Statement of Facts letters (such as H2S / HC in cargo tanks, Inert Gas in tanks)

Available statement of fact forms

Available statement of fact and notice of discrepancy forms

– Two fully customizable Notice of Discrepancy and Statement of Facts forms

The modification in the report settings:

At the bottom of the screen, there is now a switch, allowing the user to choose whether reports should automatically be saved to the camera roll (as well as being saved as pdf file):

Report settings (bottom part)

Report settings (bottom part)

download in the appstoreCargoSurveyor for iPhone can be downloaded here.

We should like to advise everyone who has downloaded the app in the past to update as soon as possible to ensure a flawless CargoSurveyor experience.

CargoSurveyor Tools for iOS Version 1.5.1 is out!

After a long period of silence on the Apple side of development, we have decided to update our existing iphone apps to the latest iphone version, iOS 11.

Last week (3rd August 2018) version 1.5.1 of CargoSurveyor Tools for iOS was published.

This update was published in order to make the app available on iOS 11, and is available for both iOS 10 and 11 devices. For older devices, version 1.4.1 remains available on the App Store (for the time being, depending on when Apple decides to change their requirements again).

The previous version of the app still had problems with scrolling larger screens in particular when editing data in text fields. Now all these issues have been solved.

Two new utilities and two new options have been added to the app:

  • Bottom lines Calculator: a tool for calculating the cargo quantity to add to or deduct from a specific grade on board the vessel. Especially applicable to Suez max vessels and VLCCs, this tool can be used if bottom line quantities are included in the ship’s tank calibration tables.
  • Pre-cargo matrix: a handy tool to check the tank cleaning requirements for loading the next cargo on tankers, and for checking whether the vessel is ready to load a next cargo.
  • File sharing is now enabled, meaning the user can download pdf files directly from iTunes (the file sharing section) into their computer.
  • An option in report settings to save reports automatically to the camera roll, instead of being asked every time about this.

The two newly added modules:

  • Bottom lines calculator: just like the bottom lines calculator for Android.
Bottom lines editor

Bottom lines editor

Add grade names

Add grade names

Enter volumes of line sections

Enter volumes of line sections

Select a grade for each tank

Select a grade for each tank

  • Pre cargo matrix: just like the same utility included in Cargo Surveyor for Android:
Pre cargo matrix tool (top)

Pre cargo matrix tool (top)

Pre cargo matrix (bottom part)

Pre cargo matrix (bottom part)

Updated 'more' screen

Updated ‘more’ screen with buttons for Bottom Lines calculator and Pre cargo Matrix

The manual for Cargo Surveyor for iPhone has not yet been updated, but the manual for the Android version is up to date, and contains descriptions for both the bottom lines calculator and the pre cargo matrix tool.

As a reminder of the features of this app, the toolbox contains (amongst others) the following items:

1: Fully configurable ullage form:

The user can choose the number of tanks, from a minimum set of 5 wing tanks plus two slop tanks, to a maximum set of 7 crosses plus two slop tanks, as well as three bottom lines:

Configure number of tanks

Configure number of tanks

Regardless of the program’s main settings, ullages /temperatures/densities/volumes can be entered in either SI Metric or Imperial units. In the same report both Metric and Imperial units can be mixed, the app will automatically convert to the right units during processing.

When the time comes to save/print or email the report, the user can choose whether to use SI Metric or Imperial units, regardless of which units have been used during the creation of the report. An unlimited number of ullage reports can be saved, and existing reports can be cloned in order to create different reports for the same ship (i.e before and after discharging etc).

The report in pdf format can be send as an email attachment from within the app, and can also be saved as a png file to the camera roll. If required, both the png file and the pdf file can then be transferred to a desktop computer for printing. In the report settings the user can choose whether reports should automatically be saved to the camera roll or not. In the previous version a dialog window would show up asking the user whether the file should be saved to the camera roll or not, every time a report is generated.

2: Fully configurable time sheet editor:

The time sheet editor comes with a whole bunch of standard entries but has ample room for new entries as required by the user. Events can be entered into the editor in any order, the app will automatically sort all entries by date and time. An unlimited number of time sheets can be saved, one for each ship and/or event as desired. Like the ullage report, the time sheet can be send as an email attachment from within the app, and can be saved to the camera roll for transferring to a computer:

Time sheet standard entries

Time sheet standard entries

iOS Simulator Screen shot Oct 31, 2014 6.22.47 PM

Time sheet details editor

3: Configurable wedge calculator:

The app contains a wedge calculator with the following features:

– calculate wedge volume based on ship/tank dimensions

– calculate wedge volume based on tank calibration table volume

– calculate wedge volume using either Metric or Imperial units

Entries made are automatically saved and restored the next time the user opens the wedge calculator.

Wedge volume using tank dimensions

Wedge volume using tank dimensions

Wedge volume using tank table volume

Wedge volume using tank table volume

4: Instant tank totals view per grade, or for all grades together:

After creating an ullage sheet and filling in a grade name, temperature, volume and density (or API) for each tank, the user can view the tank totals, either per grade or the grand totals. The totals screen will give the totals of observed volume, gross standard volume, metric tons etc, as well as the physical average temperature of the cargo.

List of available grades

List of available grades

Totals - Imperial units

Totals – Imperial units

Totals - Metric units

Totals – Metric units

Again regardless of what units have been used in the ullage report, the totals can be viewed in either Metric or Imperial units by choosing the desired unit in general settings.

 5: Detail view for each tank after entering data:

After entering data in the tank details editor, all data can be viewed for each tank in the first screen, using the buttons to select either a tank or a bottom line:

all details viewer

Details of tank 4P

Configure number of tanks

Configure number of tanks

Settings: in the ‘more’ screen the user has access to a settings panel, where there are options to:

general settings

– chose ASTM tables 1980 or 2004

– chose SI Metric or Imperial units and methods (i.e. whether to use table  6A or 54A for example)

– chose whether to calculate metric tons in air using table 56 or using  density(vac) – 11 points

– set the precision for vcf, gsv, metric tons etc


Aside from all the above, the app contains a complete set of forms as  required by marine cargo surveyors:

– Customizable report settings, including company logo, standard email recipients, report titles etc

Report settings part 1

Report settings part 1

Report settings (bottom part)

Report settings (bottom part)

 – Transfer summary (for vessel) and executive transfer summary (for the client)

Transfer summary editor (partial view)

Transfer summary editor (partial view)

transfer summary 2nd part (partial view)

transfer summary 2nd part (partial view)

transfer summary simple view

transfer summary simple view

transfer summary pdf for client

transfer summary pdf for client

– Pumping log

Pumping log editor (partial view)

Pumping log editor (partial view)

pumping log - lower half

pumping log – lower half

Pumping log report

Pumping log report

– OBQ / ROB report

OBQ/ROB report part1

OBQ/ROB report part1

OBQ/ROB report part2

OBQ/ROB report part2

OBQ/ROB report pdf

OBQ/ROB report pdf

– Slop report

Slop report part 1

Slop report part 1

Slop report part 2

Slop report part 2

Slop report pdf

Slop report pdf

– Reference heights and raw measurements report

Ref heights report part 1

Ref heights report part 1

Ref heights report part 2

Ref heights report part 2

Ref heights report pdf

Ref heights report pdf

– Bunker report

Bunker report part 1

Bunker report part 1

Bunker report part 2

Bunker report part 2

Bunker report pdf

Bunker report pdf

– VEF report

VEF report part 1

VEF report part 1

VEF report part 2

VEF report part 2

VEF report pdf

VEF report pdf

– Preloading report

Preloading report part 1

Preloading report part 1

Preloading report part 2

Preloading report part 2

Preloading report part 3

Preloading report part 3

Preloading report pdf

Preloading report pdf

– Sampling report

Sampling report part 1

Sampling report part 1

Sampling report part 2

Sampling report part 2

Sampling report pdf

Sampling report pdf

– Standard protest letters (such as ship/shore diff, ship fig/BL diff, in transit diff)

Notice of apparent discrepance example part 1

Notice of apparent discrepancy example part 1

Notice of apparent discrepance example part 2

Notice of apparent discrepancy example part 2

Notice of apparent discrepance example pdf

Notice of apparent discrepancy example pdf

– Standard Statement of Facts letters (such as H2S / HC in cargo tanks, Inert Gas in tanks)

Available statement of fact forms

Available statement of fact and notice of discrepancy forms

– Two fully customizable Notice of Discrepancy and Statement of Facts forms

The modification in the report settings:

At the bottom of the screen, there is now a switch, allowing the user to choose whether reports should automatically be saved to the camera roll (as well as being saved as pdf file):

Report settings (bottom part)

Report settings (bottom part)

download in the appstoreCargoSurveyor for iPhone can be downloaded here.

We should like to advise everyone who has downloaded the app in the past to update as soon as possible to ensure a flawless CargoSurveyor experience.

Cargo Surveyor for Android – Tutorials part 6: Ullage report – entering data in the editor

The tutorials part 6 for the Android version of Cargo Surveyor deals with the Ullage report.

Recently we discussed the fifth document of the set of documents required to be produced in the load port, the VEF report.

Today we will discuss part 6 of the tutorials, which will deal with the ullage report:

Cargo Surveyor is designed with user convenience and flexibility in mind. The app being used primarily on oil tankers and chemical tankers, we have chosen to give the user two different option sets regarding possible tank configurations:

  • a standard layout, which accommodates a minimum of 12 tanks (5 pairs of wing tanks plus two slop tanks) and 3 bottom lines, and a maximum of 23 tanks (7 crosses plus two slop tanks) and 3 bottom lines.
  • An extended layout, which accommodates a minimum of 34 tanks (16 pairs of wing tanks plus two slop tanks) and 3 bottom lines, and a maximum of 50 tanks (16 crosses plus two slop tanks) and 3 bottom lines.

The bottom lines and slop tanks can be used in any way the user wants to, they are simply considered as tanks just like the other tanks. (Not to be confused with actual bottom lines, which can either be included or excluded from tank tables). There are times however that the bottom lines L1, L2 and L3 are used to either add or deduct volume of cargo for a selected grade, and this depends indeed on whether bottom lines on the vessel are included in tank calibration tables or not, and what the grade of each bottom line is. More on this later.

When you open the app, the first screen that always appears is the layout selection screen, where you will be asked to choose between either the standard or the extended layout:

Entry screenEntry screen with options menu

In the top right hand corner of this screen is also an options menu button, that will let you straight go to general settings etc.

For our testship, being a vessel with 6 pairs of wing tanks and 2 slop tanks (plus a residual oil tank), we will select the STANDARD layout. As soon as we press the button (‘USE STANDARD LAYOUT’) we are presented with the standard layout tank configuration editor:

Standard configuration

At present only the ‘Open file’ button is enabled, all other buttons are disabled. If you previously created an ullage report than you can open that ullage report for editing by pressing the ‘Open file’ button and selecting the ullage report from the list of available reports. In our case we are going to create a new report from scratch so first we need to select the appropriate tank configuration; as soon as you press ‘Select tank configuration’, a pop up window appears where you can select a possible configuration. In these tank configurations slop tanks and bottom lines are not mentioned since they are always included:

Select tank configuration

For our testship we need to select ‘6W’: this will create an ullage report with 6 wing tanks + 2 slop tanks + 3 bottom lines. As soon as you press ‘6W’ on the drop down list in the above picture, you will notice that now all buttons 1-6P, 1-6S, Slop P, Slop S and L1, L2 and L3 buttons are enabled, as well as the ‘New File’ button.

We now press the ‘New File’ button; in the new window where we are asked to enter a file name, we can enter ‘Testship’ and press ‘OK’:

Ullage report Testship creating

We are now taken directly to the tank editor (standard layout), with the new ullage report already created and opened and tank 1P selected:

Testship ullage report editor

Within the tank editor, the first thing we see in the top of the screen is 1P:SI Metric/2004. 1P is the name of the selected tank in the list of available tanks. SI Metric means that in general settings SI Metric units has been chosen, and 2004 indicates that ASTM 2004 tables have been selected.

There are five buttons on the screen for switching units (no.6 button ‘ULLAGE’ is only to indicate whether ullage or innage is being used, but presently this is not reflected in the actual report):

– ullage between meters and feet / inches: you can select this unit for each tank individually; this is handy in case the vessel has ullage tables using feet and inches while you want to make your report in metric units: first press the ‘MTRS’ button, so that the input changes to feet, inches. The title of the button now changes to ‘FT,IN’. Now enter the ullage (say for example ‘7, 8.5’). Now press the ‘FT,IN button again, and the ullage is automatically converted to 2.350 mtrs.

– temperature between deg C and deg F: same as with ullages, you can select the unit for each tank individually and convert between deg C and deg F with the press of a button, in this case the ‘DEG C’ button below the ‘MTRS’ button.

– density between density @ 15 deg C and API at 60 deg F: as with the other units, if you press the D15 button, the density (if you have entered one) will be automatically converted to API and the title of the button changes to ‘API’.

– volume between M³ and Bbls: likewise, if you press the M³ button, any volume you have entered will be converted to Bbls, and the title of the button will change to ‘BBLS’. Both volume in the volume field and the water dip field will be converted.

– thermal expansion coefficient (Alpha) between /deg C and /deg F: if you press the ‘DEG C’ button (below the M³ button), the expansion coefficient will be converted to /deg F.

All these units (except ullage) will be converted to the selected standard in the general settings when you generate the pdf report: if in general settings you have selected ‘SI Metric’, then all values will be printed in metric units, and if you have selected ‘Imperial’, then all values will be printed in imperial units.

Ullages however, will be printed depending on one particular setting in the pdf report settings: at the bottom of the pdf report settings there is an entry called ‘Keep ullages in original units’:

Report settings

If this option is ticked, then ullages will be printed based on the ullage unit that has been used for the first tank: if the ullage of 1P is entered as ‘feet, in’ then all ullages will be printed in feet and decimal inches, regardless of whether you have selected metric or imperial units.

On the right hand side of the screen are fields to enter ullage, a maximum of three temperatures, the volume of any water in the tank, the density in vacuum at 15 deg C (or the API at 60 deg F), the tank volume, alpha (in case of special applications using table 54C or 6C and in case of chemicals), and the name of the grade.

If you have selected ‘Chemicals’ as cargo type, there is one additional field called ‘at temp’: here you can enter the temperature for the observed density (see below). Also the density button is disabled and will now have as title ‘DENSITY’ instead of ‘D15’. When chemicals is selected as cargo type, it is not possible to change the density unit to API.

At the bottom of the screen is the drop down to select the tank for which you want to enter data, currently pointing at 1P; to the left of the tank drop down is the cargo type selector, which you can set to either:

– Products

– Crude

– LubOil

– Special Applic(ations)

– Chemicals

If you select any cargo type except ‘Chemicals’, the ASTM tables are used for calculating the weights, VCF etc. In the case of Chemicals (not to confuse with ‘Special applications’) , the density is entered as observed density, together with a corresponding temperature for that density. In this case the ‘at temp’ and Alpha are used to calculate the actual weight in air. No GSV can be calculated since many chemicals such as FAME / vegetable oils are not even liquid at 15 deg C.

For all other cargo types the normal ASTM tables are used; which table is used for calculating the VCF depends on:

– The cargo type: if ‘Products’ is selected, either table 54B or 6B is used, if ‘Crude’ is selected, either table 54A or 6A is used etc.

– Whether in general settings ‘SI Metric’ or ‘Imperial’ has been selected; if Imperial is selected table 6B is used, if SI Metric is selected table 54B will be used. The same applies for Crude, LubOil and Special Applications.

Let us now enter an example referring to the screen shot below:

Testship one tank entry

Testship will load the cargo of mixed aromatics in various stages, receiving parcels with different densities from different shore tanks.

Each parcel will be loaded evenly across all tanks so as to achieve a homogeneously commingled end product.

As can be seen in the picture on the left, we have entered an ullage of 15.62 mtrs, a temperature of 21 deg C, a density in vacuo at 15 deg C of 860.7, a volume of 2506 M³ and the grade name ‘ma’.

This grade name is arbitrary, you can enter any name you wish, as long as you ensure that this grade name is exactly the same for each tank carrying this grade, because the calculation of totals per grade is dependent on the grade name.

Now if you press the back button and return to the tank configuration screen, and then press the ‘1P’ button, you will see not only the info that we have just entered but also the VCF, GSV, MTons in air/vacuum, LTons, Bbls and Gallons are all displayed for this tank.

In the bottom of the screen the title of the report, as well as the grade name are displayed in an animated scrolling text field:


Tank 1P details


Phew! It has been a pretty long session already! We will take a break here, and discuss the remainder of the ullage report session in the next tutorial, part 7.

In the mean time, for those who are interested in Cargo Surveyor for Android: the app can be downloaded here:

google-play-badge


We post updates for the app in Google Play frequently to solve minor bugs, and advise all users to update as soon as a new update is available; we don’t use advertisements in Cargo Surveyor and we never will.

If you have any queries, suggestions, comments, criticism about the app or this blog post, please let us know! We always do our best to accommodate any requests for additions/modifications to our apps if they improve the value!