
This is a tutorial for AntiCollision: a free collision avoidance practice tool, aimed at junior deck officers who are studying for their exams.
The Anticollision app is based on a real life ship model: a VLCC in both ballast and in loaded condition; in the general settings in the app the user can choose which condition to use for the current exercise.
Both the steering characteristics and the manoeuvring characteristics are based on data collected from an existing VLCC, so the vessel responds like a real vessel would.
Before we start with an exercise, let us first go through all the screens and controls in detail, to explain all features and possibilities:
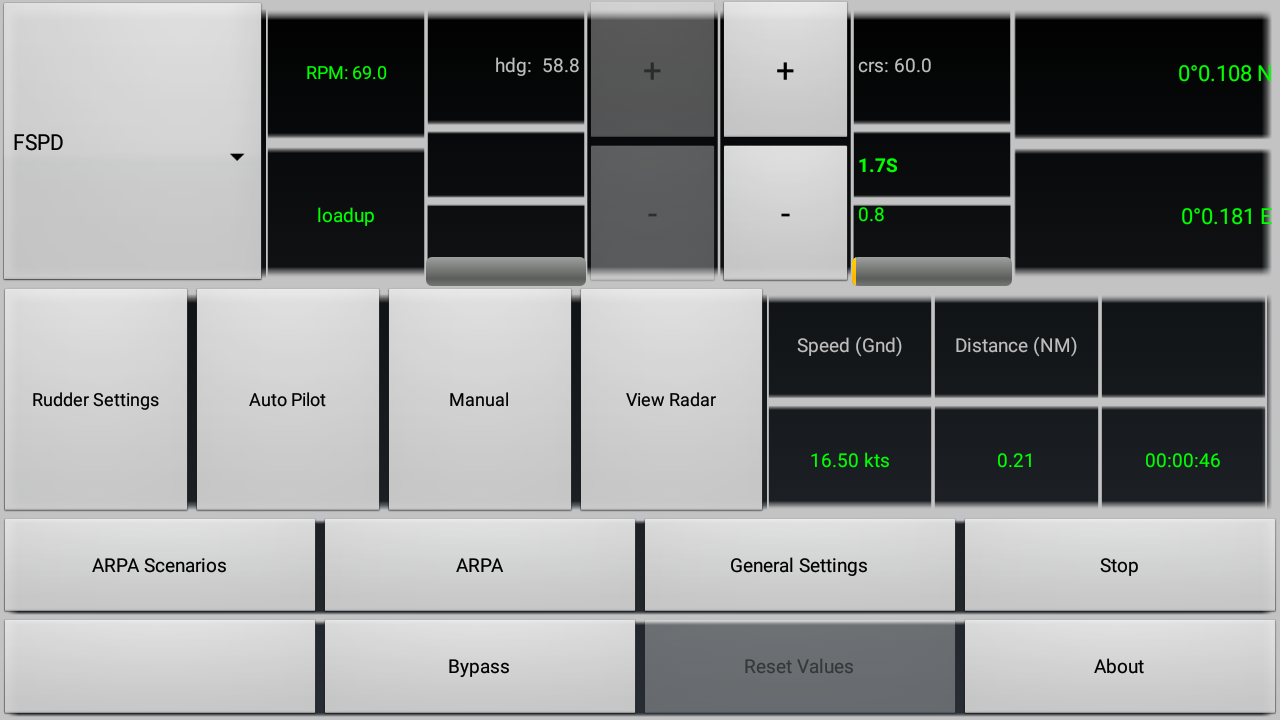
1: Main screen. The main screen has the following buttons
- General settings
- Rudder settings
- Auto Pilot
- Auto Steering: toggles between manual steering and automatic steering; in automatic steering mode the ‘+’ and ‘-‘ buttons on the right hand side are enabled, letting the user increase / decrease the set course as desired. In manual mode the ‘+’ and ‘-‘ buttons on the left hand side are enabled, letting the user increase / decrease the amount of rudder to either port or starboard side. When auto steering is enabled, the button shows ‘Manual’, and when in manual steering mode, the button shows ‘Auto Steering’.
- ARPA Scenario
- ARPA
- Reset Values: resets all values to default or zero as applicable; latitude and longitude are set to zero, speed, course to steer and actual heading are set to zero, telegraph is set to stop
- Start (Stop): start and stops the simulator; when the simulator is running, the button shows ‘Stop’, when the simulator is stopped, the button shows ‘Start’
- Bypass: override the load program for the main engine
- View Radar
- About: shows the ‘About’ screen

Main screen – portrait
main screen – landscape
All screens can be viewed in portrait or landscape mode, but the app does not rotate while the simulator is running. You need to go into the general settings to choose whether to view in landscape or portrait mode.
2: General settings:
Before running the simulator, the user can set here the following items:
- Telegraph, anywhere from Full astern (FAST) to Full sea speed (FSPD). The actual speed will be set accordingly
- Latitude
- Longitude
- Heading
- Speed: once the simulator runs, speed will be adjusted by the program to match the telegraph and steering settings
- Current rate: it is possible to introduce a current speed, although for the purpose of collision avoidance this can be left zero
- Current dir: as 6, current direction can be left zero
- Units to be used: either Nautical Miles or (Kilo)metres
- Condition: loaded condition or ballast condition, this affects the steering and manoeuvring characteristics
- ARPA alarm: the CPA distance at which vectors in the Radar screen are shown in red color. Can be set between 0.5 and 3 NMiles
- Orientation: portrait or landscape. As soon as you select Landscape, the screen will rotate, and all other screens will be presented in the same orientation, regardless of whether you rotate your phone or not.
If you press the ‘Cancel’ button, the values set or selected in the general settings screen will be ignored (except for orientation) and the app returns to the main screen. If you press ‘OK’, the app returns to the main screen, and the values as set / selected will be used to run the simulator.
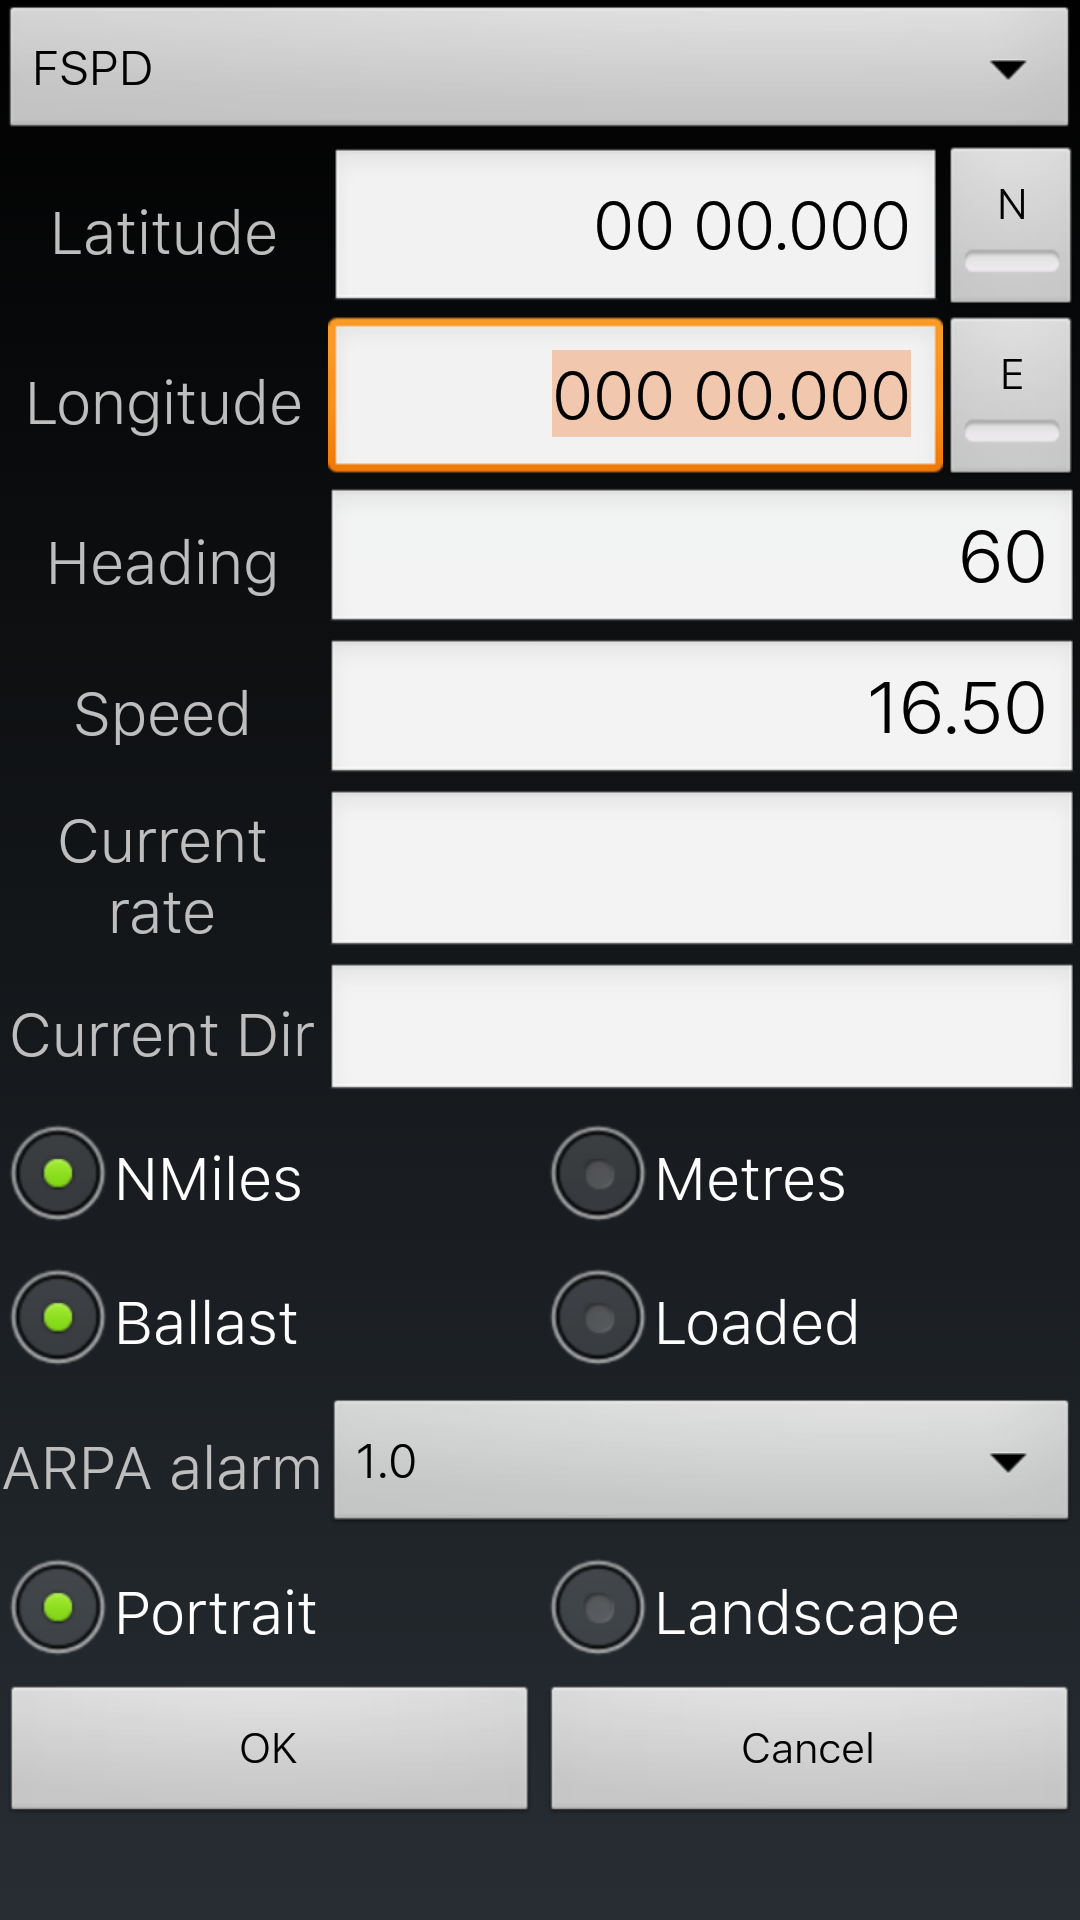
Settings – portrait

Settings – landscape
3: Rudder settings:
The following rudder settings can be changed, if no simulation is running:
- Rudder limit
- Rate limit
- Using 1 or 2 steering motors

Rudder settings – portrait

Rudder settings – landscape
4: Auto Pilot:
The auto pilot is a PID controlled steering system. Using the auto pilot screen, the parameters of the controller can be tested and tuned. This should normally be left alone, unless the user knows what he is doing. To see the control in action, once a simulation is started press the ‘Auto Pilot’ button in the main screen, and then press the ‘Start’ button in the auto pilot screen. The app will then start tracking the process values, and the ‘Start’ button now is called ‘Stop’ button. If want to change the response of the controller, press the ‘stop’ button, and change the value for PGain, DGain, Tpi or Td. After that press the ‘Update’ button, and the new values of the parameters will be stored in the app preferences. After you press ‘Start’ again, you should see a change in the response of the controller.

Auto Pilot tuning
5: ARPA Scenario: can only be accessed when the simulator is stopped
The ARPA Scenario screen contains 7 predefined scenarios which the user can choose from. When you select any of those scenarios, the data for the 2 (or 3) vessels is automatically set, relative to our own ship’s heading. Therefore settings as desired in general settings should always be set first, before selecting an ARPA scenario. Once you have selected a scenario, the vessels will automatically be activated and placed in position, and as soon as you start the simulator, you will see the ships in the Radar screen. The icon next to each Scenario button hints at the situation for each scenario, with the ship in the lower left corner being our own ship.

ARPA Scenarios
6: ARPA: can only be accessed when the simulator is stopped
The ARPA screen is the manual implementation of ARPA scenarios. A maximum of 6 ships is available that can be added to the ship’s Radar. The ARPA screen contains the following controls:
- A drop down list in the top of the screen, to select a ship (from 1 to 6)
- A field for the range from our own vessel
- A field for the bearing from our own vessel
- A field for the speed of the selected ship
- A field for the course of the selected ship
- A field for the length of the selected ship; in the current setup this data is not important
- A field for the width of the selected ship; in the current setup this data is not important
- A checkbox to mark the ship active (checkbox ticked) or inactive (unticked)
- A button ‘Random’ to fill each selected ship with more or less random data, in such a way that the vessel is within a range of 1 to 11 NMiles from our own vessel. When you press this button, the vessel is automatically selected as active.
- A button ‘Clear’ to clear all data for the selected vessel. The vessel is also set to inactive.
- A button ‘Z+’ to zoom in on the screen
- A button ‘Z-‘ to zoom out on the screen
Below the four buttons is a simplified radar screen, which shows in the right bottom corner the outer range of the rings.

ARPA screen – portrait

ARPA screen – landscape
7: RADAR screen
The Radar screen contains the following controls:
- A drop down list for the plot interval (3 – 24 minutes)
- A drop down list for the Radar range (0.25 – 48 NMiles)
- A checkbox to turn the ARPA on or off; when off, no vectors are showing and no CPA data is available, but the target ships do show up on the Radar
- Two radio buttons to switch between true and relative motion when ARPA is turned on
- A checkbox to turn range rings on or off
- A checkbox to turn trails on or off. Trails keep track of previous position of own ship and targets.
- A checkbox to turn the sweep on or off
- Two radio buttons to switch between North up and Head up
- An ‘Actions’ checkbox, used to issue commands to the telegraph and auto pilot
- A mouse cursor to show range and bearing from own ship, and to select a plot target to show plot data (in the bottom right corner of the Radar screen).
In below screenshot, the target slightly to starboard of dead ahead has been selected. The plot vector is showing a green filled square, indicating that this is the selected target, and vectors are shown in relative mode. The vector is showing in red indicating that the CPA is less than 1 NMile. The other target, on the port side is showing a white vector indicating that the CPA is more than 1 NMile. The CPA distance which triggers the red color can be set in General Settings.
The CPA data shows a CPA of 0.11 NM, with a TCPA of 10 minutes, a course of 248° and a speed of 16 kts. If you place the cursor over another target, the data of the new target will be shown flashing. Once you move the cursor to another location on the screen the flashing stops and the data will remain visible in the right hand bottom corner (this requires a bit of practice, sometimes the data will disappear).
If you want to clear the data display, just put the cursor somewhere over the CPA data (in the bottom right hand corner), and it will be cleared, and the selected target will not anymore show a green filled square.
In the second screenshot (showing landscape mode) you can see the range and bearing of the cursor displayed in the top-left corner of the Radar screen, showing 5.4 NM range and 64.3° bearing.
In the top right corner of the Radar screen two sets of data are shown alternately: the time that the simulator has been running, and the course / speed of our own vessel. If the data is up to date it is showing in green, if it is being updated it is showing in red.

Radar – portrait

Radar – landscape
If you want to take evasive action for a target, you can press the ‘Actions’ checkbox, and a menu will show up, allowing you to choose an action, such as altering course 10° to starboard, or decrease telegraph setting. As soon as you select an action the menu will disappear but you can press ‘Actions’ again if you need to change course or telegraph more. The selected command will be carried out immediately by the app, there is no need to return to the main screen for this.
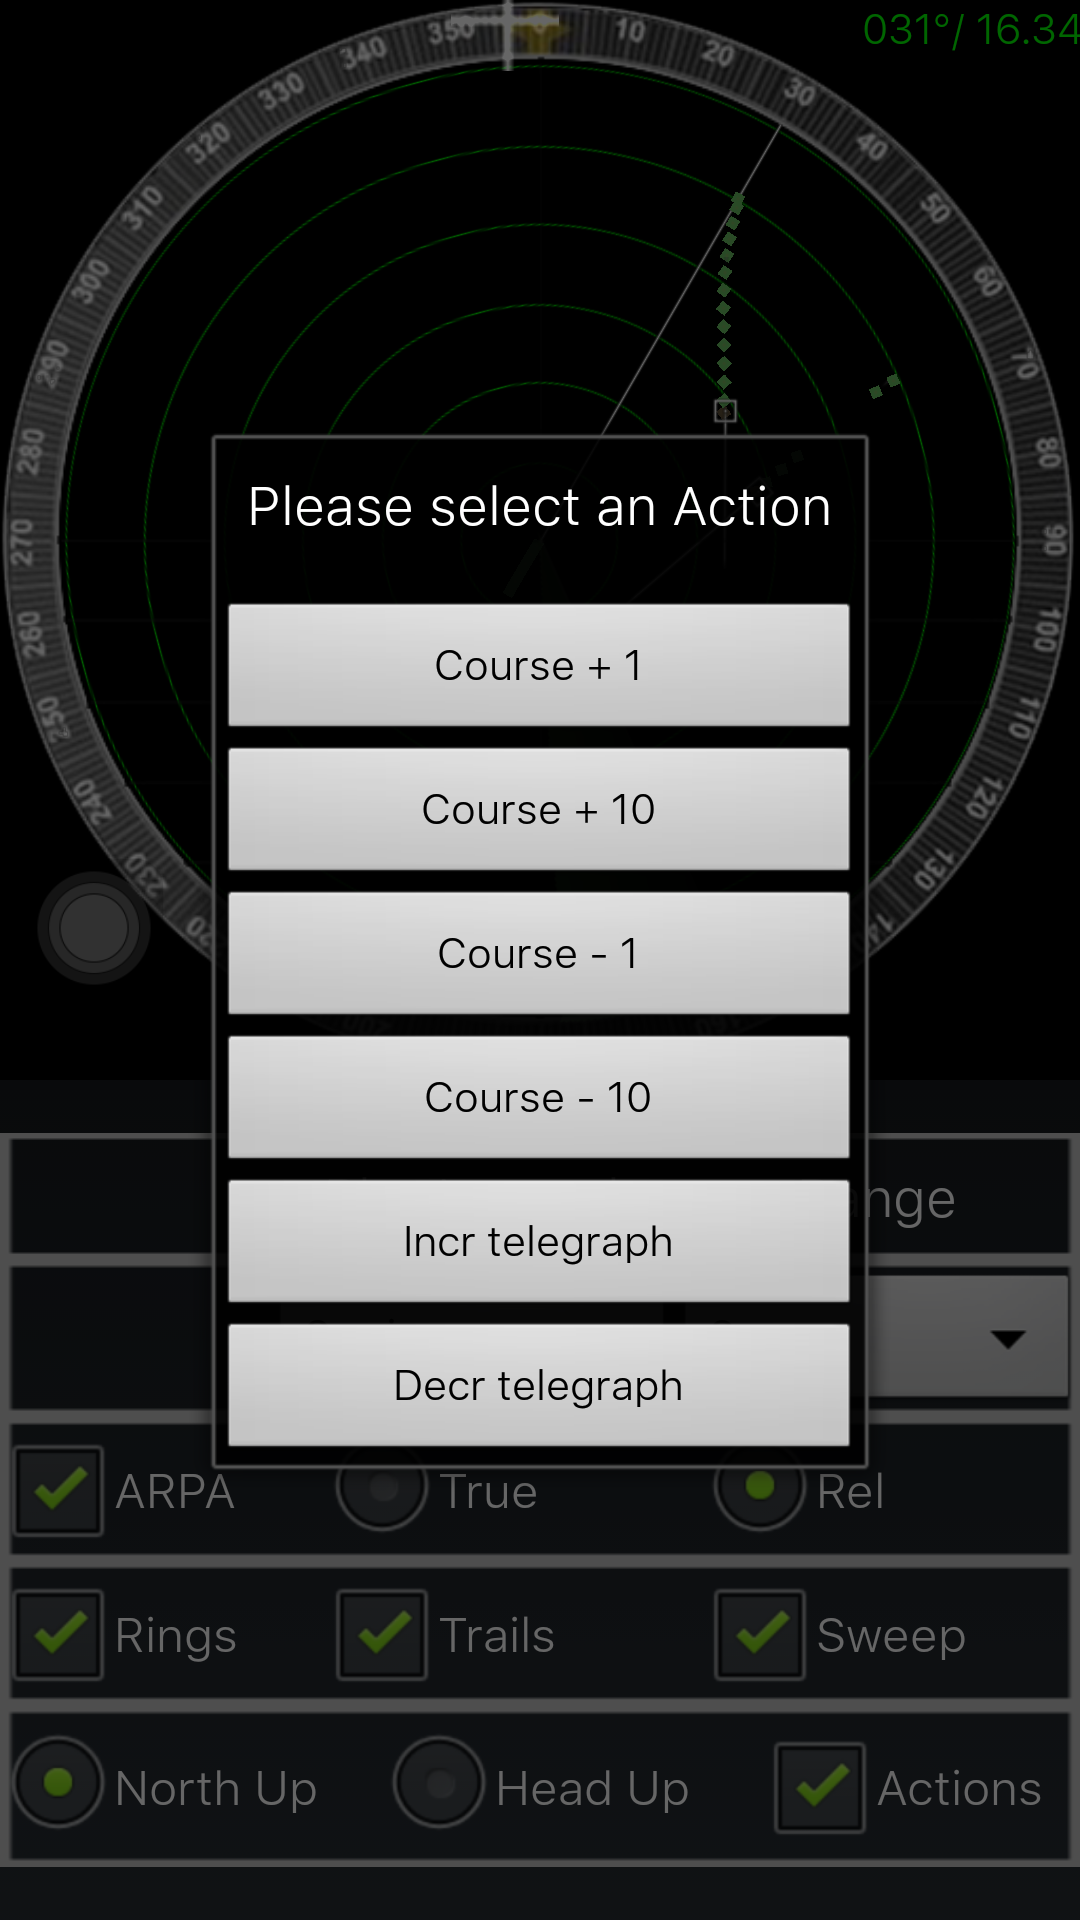
Take evasive action
Well, we have discussed all available screens and controls so far. In the next tutorial we will work out an actual example using the ARPA scenarios, and see how our vessel responds when we take evasive action.
In the meantime,
AntiCollision can be downloaded from the Play Store here:
 Also available on the App store for iPhone and iPad.


