Cargo Surveyor for Android – Tutorials part 6: Ullage report – entering data in the editor

The tutorials part 6 for the Android version of Cargo Surveyor deals with the Ullage report.

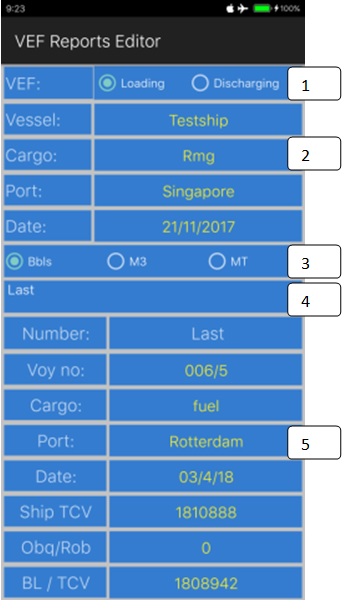
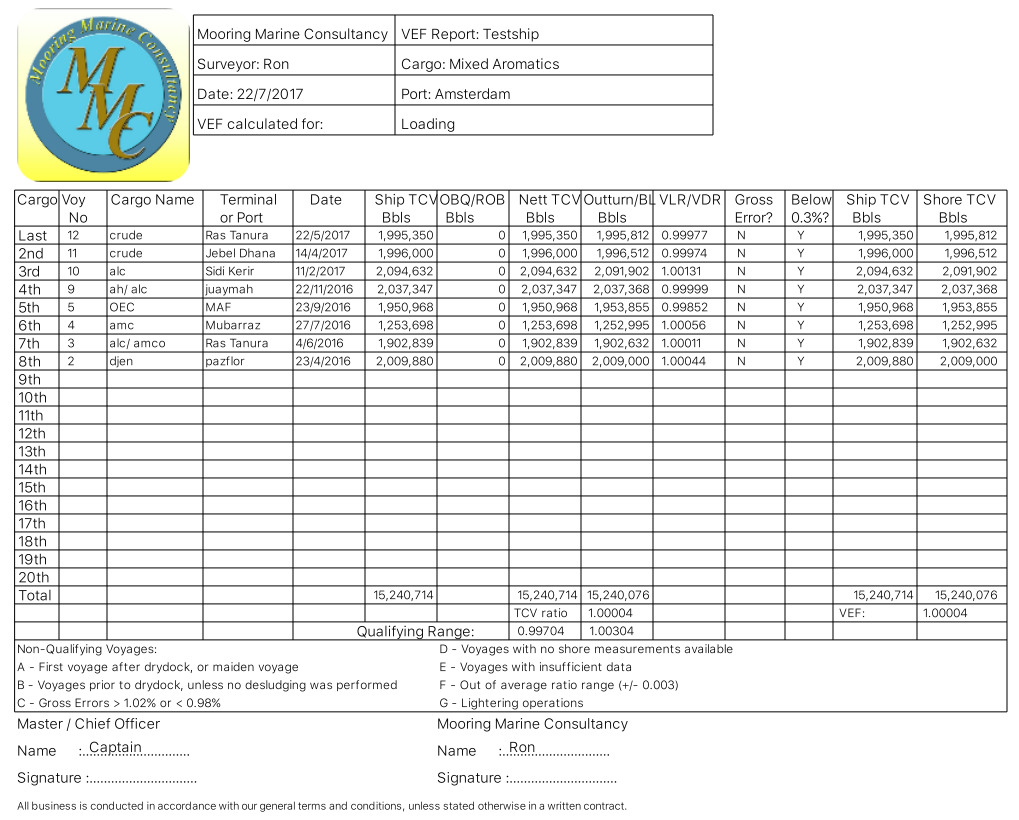
Recently we discussed the fifth document of the set of documents required to be produced in the load port, the VEF report.

Today we will discuss part 6 of the tutorials, which will deal with the ullage report:

Cargo Surveyor is designed with user convenience and flexibility in mind. The app being used primarily on oil tankers and chemical tankers, we have chosen to give the user two different option sets regarding possible tank configurations:

  • a standard layout, which accommodates a minimum of 12 tanks (5 pairs of wing tanks plus two slop tanks) and 3 bottom lines, and a maximum of 23 tanks (7 crosses plus two slop tanks) and 3 bottom lines.
  • An extended layout, which accommodates a minimum of 34 tanks (16 pairs of wing tanks plus two slop tanks) and 3 bottom lines, and a maximum of 50 tanks (16 crosses plus two slop tanks) and 3 bottom lines.

The bottom lines and slop tanks can be used in any way the user wants to, they are simply considered as tanks just like the other tanks. (Not to be confused with actual bottom lines, which can either be included or excluded from tank tables). There are times however that the bottom lines L1, L2 and L3 are used to either add or deduct volume of cargo for a selected grade, and this depends indeed on whether bottom lines on the vessel are included in tank calibration tables or not, and what the grade of each bottom line is. More on this later.

When you open the app, the first screen that always appears is the layout selection screen, where you will be asked to choose between either the standard or the extended layout:

Entry screenEntry screen with options menu

In the top right hand corner of this screen is also an options menu button, that will let you straight go to general settings etc.

For our testship, being a vessel with 6 pairs of wing tanks and 2 slop tanks (plus a residual oil tank), we will select the STANDARD layout. As soon as we press the button (‘USE STANDARD LAYOUT’) we are presented with the standard layout tank configuration editor:

Standard configuration

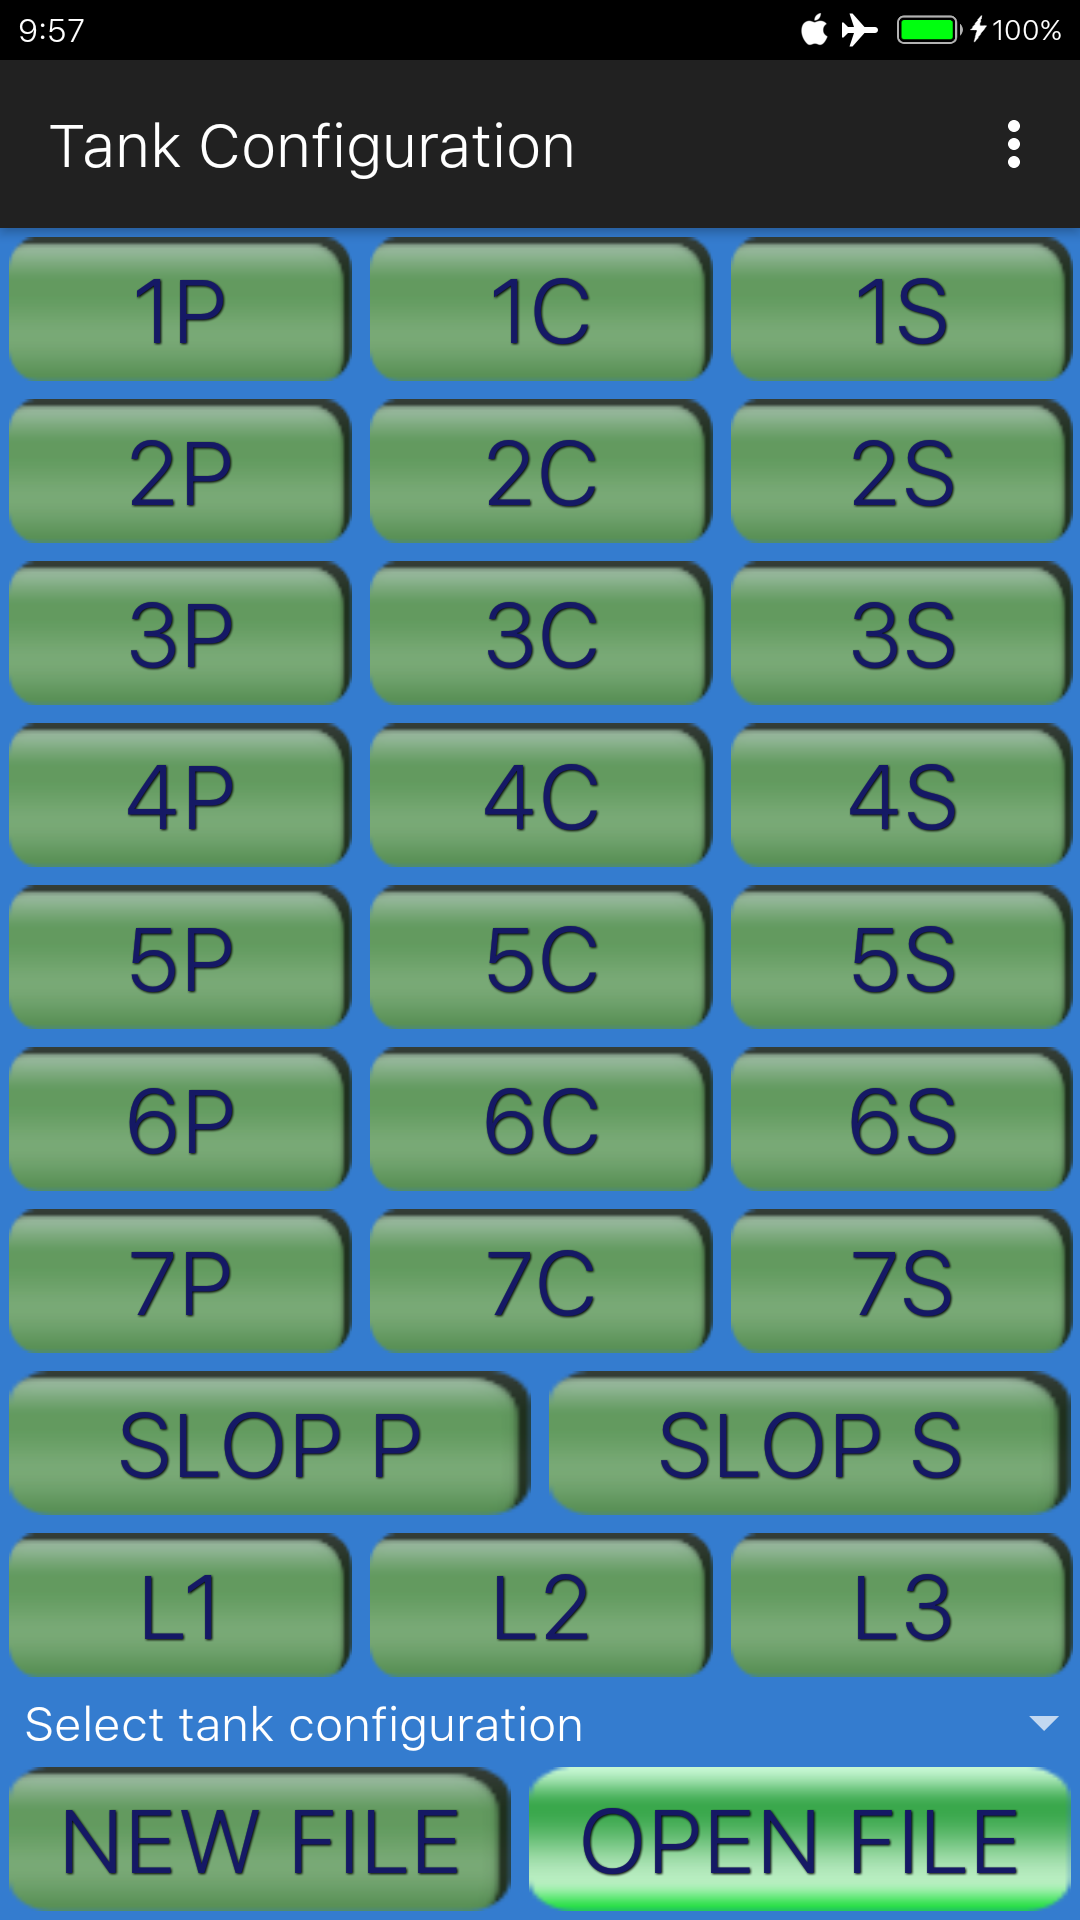
At present only the ‘Open file’ button is enabled, all other buttons are disabled. If you previously created an ullage report than you can open that ullage report for editing by pressing the ‘Open file’ button and selecting the ullage report from the list of available reports. In our case we are going to create a new report from scratch so first we need to select the appropriate tank configuration; as soon as you press ‘Select tank configuration’, a pop up window appears where you can select a possible configuration. In these tank configurations slop tanks and bottom lines are not mentioned since they are always included:

Select tank configuration

For our testship we need to select ‘6W’: this will create an ullage report with 6 wing tanks + 2 slop tanks + 3 bottom lines. As soon as you press ‘6W’ on the drop down list in the above picture, you will notice that now all buttons 1-6P, 1-6S, Slop P, Slop S and L1, L2 and L3 buttons are enabled, as well as the ‘New File’ button.

We now press the ‘New File’ button; in the new window where we are asked to enter a file name, we can enter ‘Testship’ and press ‘OK’:

Ullage report Testship creating

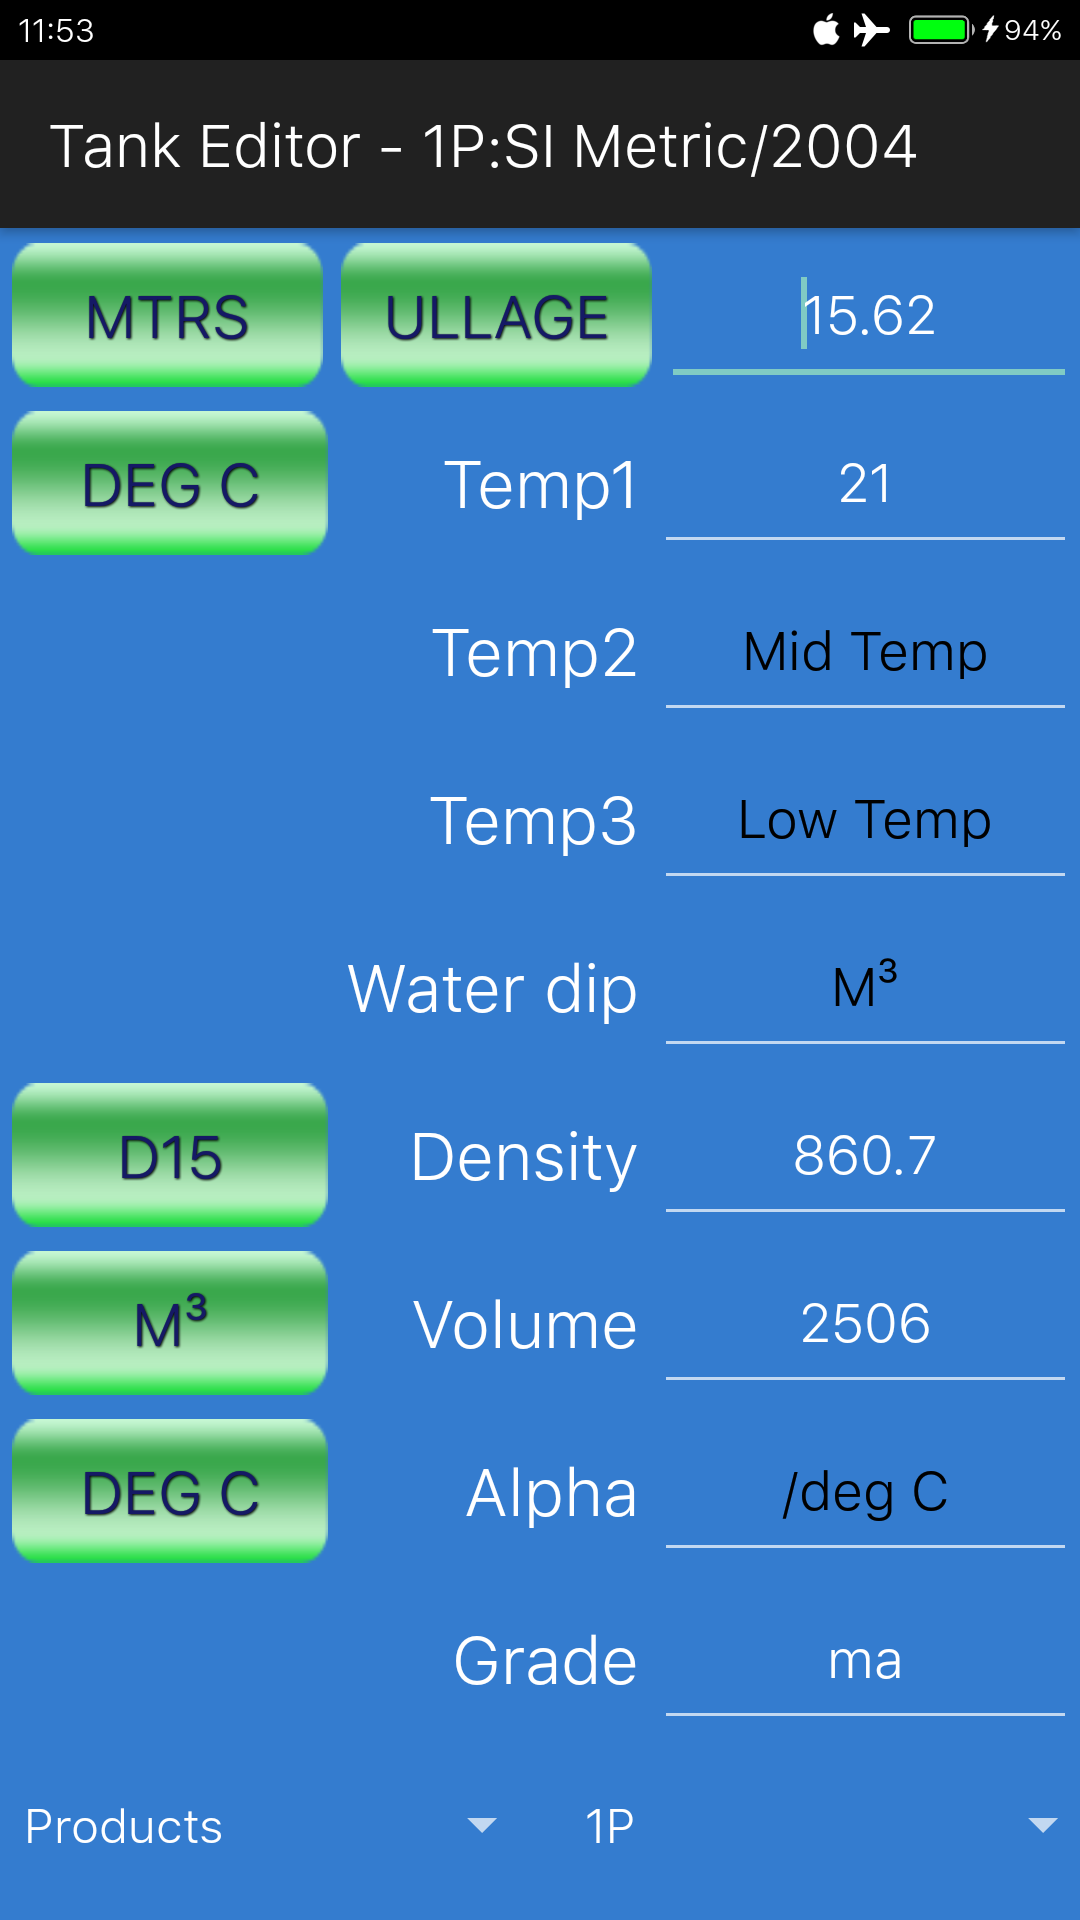
We are now taken directly to the tank editor (standard layout), with the new ullage report already created and opened and tank 1P selected:

Testship ullage report editor

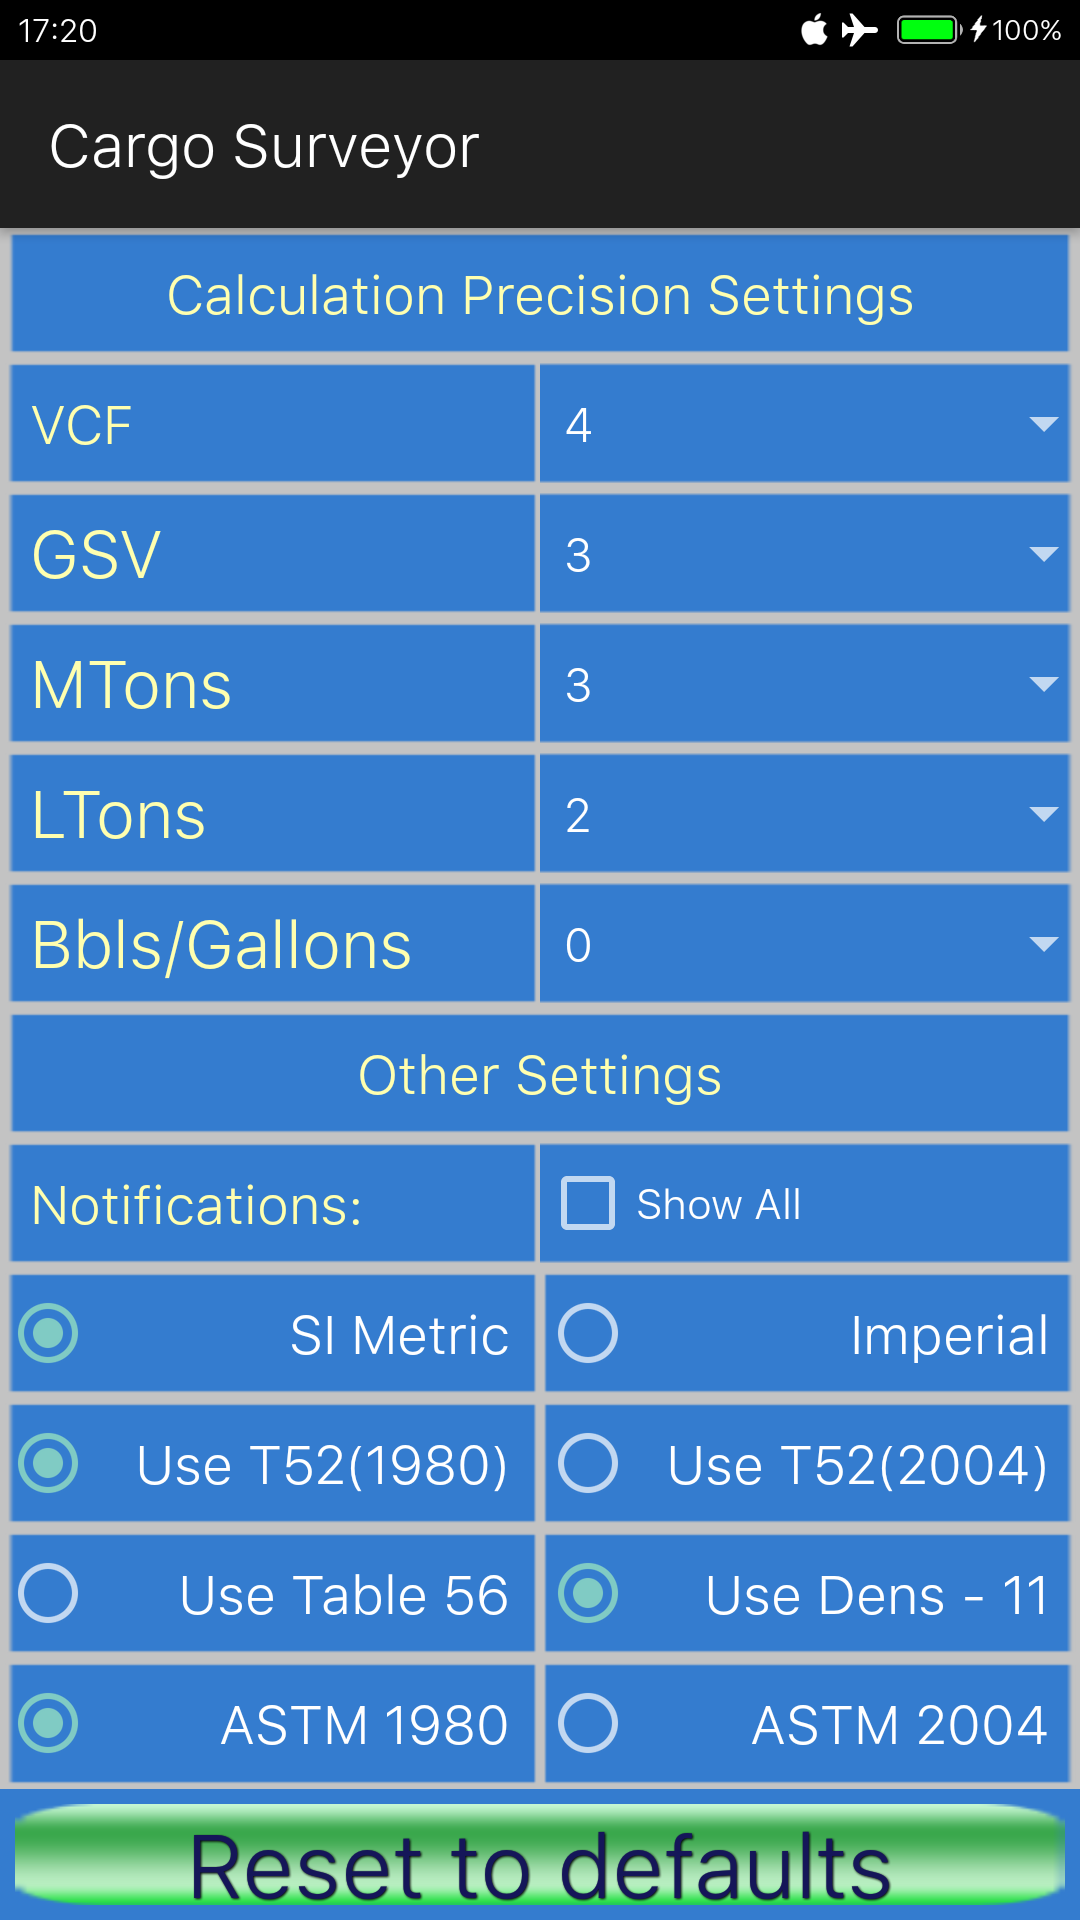
Within the tank editor, the first thing we see in the top of the screen is 1P:SI Metric/2004. 1P is the name of the selected tank in the list of available tanks. SI Metric means that in general settings SI Metric units has been chosen, and 2004 indicates that ASTM 2004 tables have been selected.

There are five buttons on the screen for switching units (no.6 button ‘ULLAGE’ is only to indicate whether ullage or innage is being used, but presently this is not reflected in the actual report):

– ullage between meters and feet / inches: you can select this unit for each tank individually; this is handy in case the vessel has ullage tables using feet and inches while you want to make your report in metric units: first press the ‘MTRS’ button, so that the input changes to feet, inches. The title of the button now changes to ‘FT,IN’. Now enter the ullage (say for example ‘7, 8.5’). Now press the ‘FT,IN button again, and the ullage is automatically converted to 2.350 mtrs.

– temperature between deg C and deg F: same as with ullages, you can select the unit for each tank individually and convert between deg C and deg F with the press of a button, in this case the ‘DEG C’ button below the ‘MTRS’ button.

– density between density @ 15 deg C and API at 60 deg F: as with the other units, if you press the D15 button, the density (if you have entered one) will be automatically converted to API and the title of the button changes to ‘API’.

– volume between M³ and Bbls: likewise, if you press the M³ button, any volume you have entered will be converted to Bbls, and the title of the button will change to ‘BBLS’. Both volume in the volume field and the water dip field will be converted.

– thermal expansion coefficient (Alpha) between /deg C and /deg F: if you press the ‘DEG C’ button (below the M³ button), the expansion coefficient will be converted to /deg F.

All these units (except ullage) will be converted to the selected standard in the general settings when you generate the pdf report: if in general settings you have selected ‘SI Metric’, then all values will be printed in metric units, and if you have selected ‘Imperial’, then all values will be printed in imperial units.

Ullages however, will be printed depending on one particular setting in the pdf report settings: at the bottom of the pdf report settings there is an entry called ‘Keep ullages in original units’:

Report settings

If this option is ticked, then ullages will be printed based on the ullage unit that has been used for the first tank: if the ullage of 1P is entered as ‘feet, in’ then all ullages will be printed in feet and decimal inches, regardless of whether you have selected metric or imperial units.

On the right hand side of the screen are fields to enter ullage, a maximum of three temperatures, the volume of any water in the tank, the density in vacuum at 15 deg C (or the API at 60 deg F), the tank volume, alpha (in case of special applications using table 54C or 6C and in case of chemicals), and the name of the grade.

If you have selected ‘Chemicals’ as cargo type, there is one additional field called ‘at temp’: here you can enter the temperature for the observed density (see below). Also the density button is disabled and will now have as title ‘DENSITY’ instead of ‘D15’. When chemicals is selected as cargo type, it is not possible to change the density unit to API.

At the bottom of the screen is the drop down to select the tank for which you want to enter data, currently pointing at 1P; to the left of the tank drop down is the cargo type selector, which you can set to either:

– Products

– Crude

– LubOil

– Special Applic(ations)

– Chemicals

If you select any cargo type except ‘Chemicals’, the ASTM tables are used for calculating the weights, VCF etc. In the case of Chemicals (not to confuse with ‘Special applications’) , the density is entered as observed density, together with a corresponding temperature for that density. In this case the ‘at temp’ and Alpha are used to calculate the actual weight in air. No GSV can be calculated since many chemicals such as FAME / vegetable oils are not even liquid at 15 deg C.

For all other cargo types the normal ASTM tables are used; which table is used for calculating the VCF depends on:

– The cargo type: if ‘Products’ is selected, either table 54B or 6B is used, if ‘Crude’ is selected, either table 54A or 6A is used etc.

– Whether in general settings ‘SI Metric’ or ‘Imperial’ has been selected; if Imperial is selected table 6B is used, if SI Metric is selected table 54B will be used. The same applies for Crude, LubOil and Special Applications.

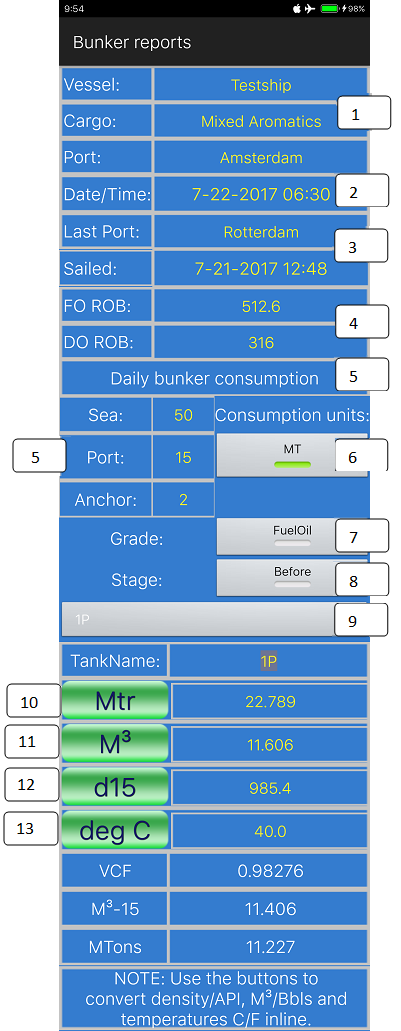
Let us now enter an example referring to the screen shot below:

Testship one tank entry

Testship will load the cargo of mixed aromatics in various stages, receiving parcels with different densities from different shore tanks.

Each parcel will be loaded evenly across all tanks so as to achieve a homogeneously commingled end product.

As can be seen in the picture on the left, we have entered an ullage of 15.62 mtrs, a temperature of 21 deg C, a density in vacuo at 15 deg C of 860.7, a volume of 2506 M³ and the grade name ‘ma’.

This grade name is arbitrary, you can enter any name you wish, as long as you ensure that this grade name is exactly the same for each tank carrying this grade, because the calculation of totals per grade is dependent on the grade name.

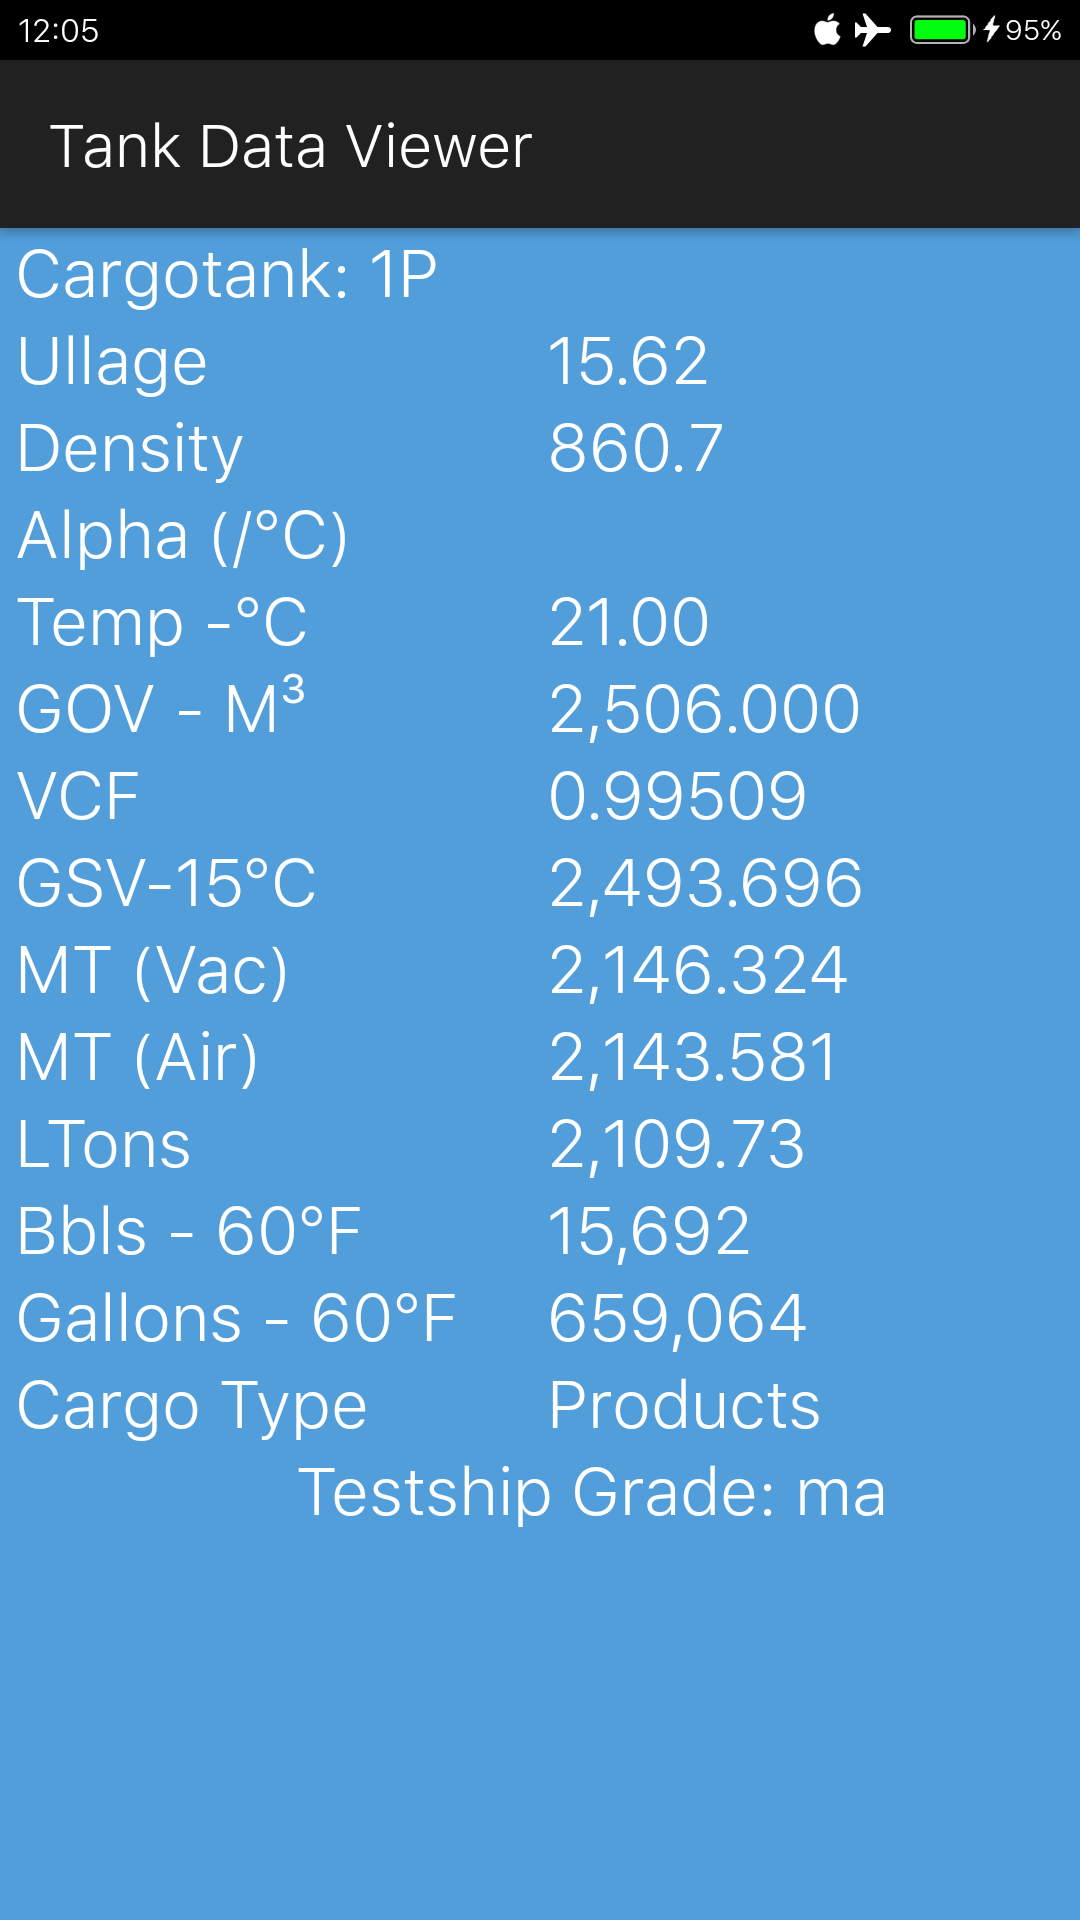
Now if you press the back button and return to the tank configuration screen, and then press the ‘1P’ button, you will see not only the info that we have just entered but also the VCF, GSV, MTons in air/vacuum, LTons, Bbls and Gallons are all displayed for this tank.

In the bottom of the screen the title of the report, as well as the grade name are displayed in an animated scrolling text field:


Tank 1P details


Phew! It has been a pretty long session already! We will take a break here, and discuss the remainder of the ullage report session in the next tutorial, part 7.

In the mean time, for those who are interested in Cargo Surveyor for Android: the app can be downloaded here:

google-play-badge


We post updates for the app in Google Play frequently to solve minor bugs, and advise all users to update as soon as a new update is available; we don’t use advertisements in Cargo Surveyor and we never will.

If you have any queries, suggestions, comments, criticism about the app or this blog post, please let us know! We always do our best to accommodate any requests for additions/modifications to our apps if they improve the value!

Cargo Surveyor for Android – Tutorials part 5: VEF report

The tutorials part 5 for the Android version of Cargo Surveyor deals with the VEF report.

Recently we discussed the fourth document of the set of documents required to be produced in the load port, the Bunker report.

Today we will discuss part 5 of the tutorials, which will deal with the VEF report:

To get to the VEF editor we first need to go to the list of reports (‘Pdf/jpg Reports’), which can be accessed by pressing the options menu button (on newer phones this in the top right hand corner of the screen); this options menu is available from within:

  • the first screen when you open the app
  • the tank configuration screen for standard layout
  • the tank configuration screen for extended layout

Options menu to report list

After pressing the option ‘Pdf/jpg Reports’, the list of available types of reports appears. If you accessed this from the very first screen, a message comes up first, asking you to confirm whether to use standard or extended layout for ullage reports. For VEF reports you can choose either, it makes no difference. The choice between extended and standard layout is only important for ullage reports and transfer summary reports:

Pdf reports listChoose layout

After selecting ‘EXTENDED’ or ‘STANDARD’ (if applicable), from the list above you select ‘VEF reports’, and this will bring you to the list of available VEF reports. If this is the first time that you are going to create a VEF report, the list will show only one entry: ‘Create new entry’:

VEF create new report

After pressing the ‘Create new entry’ line in the list, you will be asked to enter a title for the report, we can simply use our ‘Testship’ as title:

VEF for testship created

Once you press ‘OK’, the VEF reports list shows the new entry ‘Testship’. The here described process for accessing the pdf/jpg reports, and for creating a new pdf/jpg report is the same for all the reports except for the ullage report and transfer report; the ullage report is created from within the STANDARD and EXTENDED tank layout. The transfer report is created based on the selection of two existing ullage reports. More on this in future tutorials.

Now if you select the ‘Testship’ entry, the VEF reports editor appears if you select ‘Load/Edit data’ from the list of available actions:

VEF report available actions

VEF editor

The following controls are available:


  1. Button to choose VEF for loading or discharging.
  2. These 4 entries (vessel, cargo, port and date) will be supplied by report settings if they exist, and can be overwritten.
  3. Buttons for choosing units, either Bbls, M³ GSV or Mtons. The units can only be changed when the first entry (‘Last’) is selected.
  4. Voyage picker. There are altogether 20 voyage entries available.
  5. For each voyage entry the data shown in the left hand picture should be entered.


The VEF report is created / edited and send by email / saved to phone from here. As with other reports, when you click the name of the report in the reports list, the app shows you a list of available reports or an entry titled ‘Create new entry’ if there are no available reports. If you select ‘Create new entry’ you can enter a ship name or other suitable title for the report.

As mentioned in the previous tutorials, within the list of available reports there is a shortcut to the settings page, to be able to quickly change settings such as whether to use SI Metric or Imperial. In the VEF report you can use the setting for selecting 1980 version or 2004 version table to change the number of decimals shown for the VEF.

Once your report is created and you select the report, you can delete, copy, edit or view the report, and also create a new report.


The first 4 entries are taken from report settings and can be overwritten manually.  The VEF editor has two settings: Units that are used for the quantities – Bbls, M³ or Mtons, and Operation – either loading or discharging. Normally the VEF is calculated for loading operations.

Once you are done with creating and editing and return to the list of reports, you can choose to view the report, and you will again be given the options to send by email and export to csv file as with other reports.

The report calculates the qualifying range, automatically excludes voyages with a gross ratio of more than 1.02 or less than 0.98 and voyages which deviate more than 0.3% from the average. If any other voyages need to be excluded you need to omit them from the list of entries (for reasons such as first voyage after dry dock etc).

Below you can see an example of the VEF report:

VEF report

Note that the VEF is displayed in the above example with 5 decimals; if you wish to show the VEF using 4 decimals only, then you need to change the table version setting in general settings from ASTM 2004 to ASTM1980:

General settings

For more details on the reports in general (importing, exporting etc), please refer to the instruction manual, which can be downloaded from this website: in the top of the current page there is a tab named ‘User manuals for Oil Calculators’ where you can find the instruction manuals for most apps.

This is the end of part 5 of this tutorial; in part 6 we will discuss the ullage report. In the mean time, for those who are interested in Cargo Surveyor for Android: the app can be downloaded here:

google-play-badge


We post updates for the app in Google Play frequently to solve minor bugs, and advise all users to update as soon as a new update is available; we don’t use advertisements in Cargo Surveyor and we never will.

If you have any queries, suggestions, comments, criticism about the app or this blog post, please let us know! We always do our best to accommodate any requests for additions/modifications to our apps if they improve the value!

Cargo Surveyor for Android – Tutorials part 4: Bunker report

The tutorials part 4 for the Android version of Cargo Surveyor deals with the Bunker report.

Recently we discussed the third document of the set of documents required to be produced in the load port, the Slop report.

Today we will discuss part 4 of the tutorials, which will deal with the Bunker report:

To get to the Bunker report editor we first need to go to the list of reports (‘Pdf/jpg Reports’), which can be accessed by pressing the options menu button (on newer phones this in the top right hand corner of the screen); this options menu is available from within:

  • the first screen when you open the app
  • the tank configuration screen for standard layout
  • the tank configuration screen for extended layout

Options menu to report list

After pressing the option ‘Pdf/jpg Reports’, the list of available types of reports appears. If you accessed this from the very first screen, a message comes up first, asking you to confirm whether to use standard or extended layout for ullage reports. For Bunker reports you can choose either, it makes no difference. The choice between extended and standard layout is only important for ullage reports and transfer summary reports:

Pdf reports listChoose layout

After selecting ‘EXTENDED’ or ‘STANDARD’ (if applicable), from the list above you select ‘Bunker reports’, and this will bring you to the list of available Bunker reports. If this is the first time that you are going to create a Bunker report, the list will show only one entry: ‘Create new entry’:

Bunker report no entries

After pressing the ‘Create new entry’ line in the list, you will be asked to enter a title for the report, we can simply use our ‘Testship’ as title:


Once you press ‘OK’, the Bunker reports list shows the new entry ‘Testship’. The here described process for accessing the pdf/jpg reports, and for creating a new pdf/jpg report is the same for all the reports except for the ullage report and transfer report; the ullage report is created from within the STANDARD and EXTENDED tank layout. The transfer report is created based on the selection of two existing ullage reports. More on this in future tutorials.

Select testship from bunker reports

Now when you select the ‘Testship’ entry, the Bunker reports editor appears if you select ‘Load/Edit data’ from the list of available actions:


Testship bunker editor

The following controls are available in the Bunker report editor:

  1. Fields for vessel, port and cargo: these 3 entries are taken from the report settings if they exist and can be overwritten. They can only be entered / changed when the 1st tank is selected.
  2. Arrival date and time field. When you press the field, a calendar and clock appear in which you can select the appropriate date and time.
  3. Sailed date and time: same as in arrival date / time.
  4. FO and DO ROB on sailing from last port
  5. Daily bunker consumption fields for at Sea / in Port / at Anchor, both for FO and DO.
  6. Tonnes unit, choose between Metric and Long tons (for daily consumption).
  7. Grade: choose between Fuel Oil and Diesel Oil. The full report consists of 4 parts: Fuel before, after and Diesel before and after.
  8. Stage: choose before or after (see 7)
  9. Tank name: when creating a new report, 10 tanks are created both for fuel and diesel, but their names are all blank. When you change a tank name to a proper name, this will be reflected in the tank picker.
  10. Ullage units, either Mtrs or Ft and inches. If you change the setting while there are values in the applicable fields, these will automatically be converted.
  11. Volume unit, either M³ or Bbls. The same applies as with ullage units.
  12. Density unit, either density in vacuum at 15ºC or API value. The same applies as with ullage units.
  13. Temperature unit, either deg C or F. The same applies as with ullage units.
  14. Fields for entering both FO and DO consumption.

The units can only be changed when the very first tank (for ‘FuelOil’, in stage ‘Before’) is selected. As soon as you select ‘DieselOil’, ‘After’, or another tank, all unit buttons are disabled.

After a report is created, you can print it using either SI Metric settings or Imperial settings; regardless of what units you have used to enter the data in the report, the report will be printed using the general settings as selected.

In other words, if you have entered your data in Metric units but select ‘Imperial’ in general settings, the report will be printed using Feet and inches for ullage, Bbls for volume, API for density and °F for temperatures.

Further down below you can see the two pdf pages created using Imperial settings. Please note that although we entered values in SI Metric units (see the picture above), in the report Imperial units have been used.

Just like with ullage reports, if you have selected to use the ASTM 2004 tables, then the VCF will be calculated and printed in 5 decimals (as can be seen in the reports).


Creating and editing a bunker report:

The Bunker report is created, edited and send by email / saved to phone from here. As with other reports, when you click the name of the report in the reports list, the app shows you a list of available reports or an entry titled ‘Create new entry’ if there are no available reports. If you select ‘Create new entry’ you need to enter a ship name or other suitable title for the report.

Create or edit bunker report

While inside the list (as shown above), there is an options menu that will take you to the settings page, to be able to quickly change settings such as whether to use SI Metric or Imperial.

Once your report is created and you select the entry, you can delete, copy, edit or view the report, and also create a new report.

The first 3 entries are taken from report settings and can be overwritten manually. The report consists of two sections: Fuel Oil and Diesel Oil. For each section there are two sets of data: Before and after. There is no field for a disclaimer; the disclaimer info is taken from the report settings.

Bunker dateBunker time

In the top part of the editor you can enter date and time for the ‘Before’ section or ‘After’ section, as selected by the setting of the ‘Stage’ switch. (Item 8 in the picture above of the editor).

Also data concerning last port, date/time sailed, and ROB for Fuel and Diesel Oil can be entered here.

These can only be entered when the ‘Before’ stage is selected.

Below these entries you can enter the daily bunker consumption (both for Fuel and Diesel oil) as advised by Chief Engineer, for days at sea, in port or at anchor. Also you can select here whether these are specified in Metric tons or Long tons.

Below the daily bunker consumption are the two switches that you use to select either Fuel Oil or Diesel Oil, and the before or after stage.

Regardless of which tank you are editing, you can at any time switch between Fuel Oil and Diesel Oil and between before and after. Whenever you change one of these, the tank picker automatically goes back to the first tank in the list.

Initially the tank names are all blank. Once you start editing the report you can change the names into an appropriate designation. Tank names can only be changed when the ‘Before’ stage is selected.

For each tank you can enter ullage, volume, temperature and density. For all of them the unit can be changed, and existing values will be converted automatically. The app will calculate and display volume correction factor, GSV and Metric tons in air as you type in values. Once a unit is chosen, this will be used for all tanks.

When you switch the Fuel Oil switch to Diesel Oil, both daily consumption figures and tank data are displayed for Diesel Oil, and vice versa. In order to enter the daily consumption for either Fuel or Diesel Oil, make sure to have the first tank (within the Fuel or Diesel group) selected, otherwise the three fields will not be enabled.

Tonnes unit: switch to select either MTons or LTons as unit; this serves both to indicate the unit for the daily consumption and to display the tons for a selected tank in the app. In the generated report both MTons and LTons are calculated and shown.

The arrival date and time field is used both for arrival and departure (or for before and after an operation). The date in the top header (on the printed report) comes initially from the date entered in report settings; if this is empty, the app will enter as date the departure date if available; if not available the app will use the arrival date.

Departure date here is not to be confused with sailing date, which is the date the vessel sailed from the last port, whereas arrival and departure date only concern themselves with the start and finish of either the cargo operation or a bunkering operation.

Once you are done with creating and editing and return to the list of reports, you can choose to view the report, and you will again be given the options to send by email and export to csv file as with other reports.

In the pdf or jpg report, all calculated data is shown for each tank, together with a totals for both grades before, and after. The example below shows a report that has already been completed (including the bunkers on completion of the port operation).

Bunker report p1


Bunker report p2

This is the end of part 4 of this tutorial; in part 5 we will discuss the VEF report. In the mean time, for those who are interested in Cargo Surveyor for Android: the app can be downloaded here:

google-play-badge


We post updates for the app in Google Play frequently to solve minor bugs, and advise all users to update as soon as a new update is available; we don’t use advertisements in Cargo Surveyor and we never will.

If you have any queries, suggestions, comments, criticism about the app or this blog post, please let us know! We always do our best to accommodate any requests for additions/modifications to our apps if they improve the value!

Cargo Surveyor for Android – Tutorials part 3: Slop report

The tutorials part 3 for the Android version of Cargo Surveyor deals with the Slop report.

Recently we discussed the second document of the set of documents required to be produced in the load port, the OBQ report.

Today we will discuss part 3 of the tutorials, which will deal with the Slop report:

Upon completion of the tank inspection, we can also enter our findings in the Slop report editor, if applicable.

To get to the Slop report editor we first need to go to the list of reports (‘Pdf/jpg Reports’), which can be accessed by pressing the options menu button (on newer phones this in the top right hand corner of the screen); this options menu is available from within:

  • the first screen when you open the app
  • the tank configuration screen for standard layout
  • the tank configuration screen for extended layout

Options menu to report list

After pressing the option ‘Pdf/jpg Reports’, the list of available types of reports appears. If you accessed this from the very first screen, a message comes up first, asking you to confirm whether to use standard or extended layout for ullage reports. For Slop reports you can choose either, it makes no difference. The choice between extended and standard layout is only important for ullage reports and transfer summary reports:

Pdf reports listChoose layout

After selecting ‘EXTENDED’ or ‘STANDARD’ (if applicable), from the list above you select ‘Slop reports’, and this will bring you to the list of available Slop reports. If this is the first time that you are going to create a Slop report, the list will show only one entry: ‘Create new entry’:

Slop no entries

After pressing the ‘Create new entry’ line in the list, you will be asked to enter a title for the report, we can simply use our ‘Testship’ as title:

Slop create testhip

Once you press ‘OK’, the Slop reports list shows the new entry ‘Testship’. The here described process for accessing the pdf/jpg reports, and for creating a new pdf/jpg report is the same for all the reports except for the ullage report and transfer report; the ullage report is created from within the STANDARD and EXTENDED tank layout. The transfer report is created based on the selection of two existing ullage reports. More on this in future tutorials.

Now if you select the ‘Testship’ entry, the Slop reports editor appears if you select ‘Load/Edit data’ from the list of available actions:

Slop selecting testship


Slop report editor

When we first open this editor, ship name, port, date and cargo name will already have been filled in if we entered this information in the report settings, as discussed earlier.

Below the field for the cargo name you can see the drop down for the tank number. This works the same as with the OBQ report. Although on our Testship the slop tanks are empty and designated to load our cargo of mixed aromatics, the ship does have one additional tank, the Residual Oil Tank, which we can name ‘ROT’ here.

Below the tank number drop down there are switches for the units of distance, volume and temperature, and we can choose between density and API. All these units can only be changed when the first tank is selected. Please note that if you select ‘Chemicals’ as cargo type, you do not have a choice between density and API.

Below these switches is the field for the tank name, initially showing ‘1’. As soon as you change the name of the tank, this change is reflected in the tank selector as well.

Once you have changed the tank name to what you want it to be (ROT in our example), we can set the cargo type: the available types are: Crude, Products, LubOils, Special (as in special applications) and Chemicals.

If you select ‘Special’ then an additional field will appear under the ‘d15’ field: ’Alpha/C’, for the thermal expansion coefficient.

Likewise if you select ‘Chemicals, instead of ‘d15’ the density unit will show ‘dens’, and two additional fields show up: the ‘Alpha/C’ field for the thermal expansion coefficient, and ‘Temp for density’, since the density entered is not the density at 15ºC when dealing with chemicals.

The user can enter as many tanks as required, and each tank can have a different cargo type, but cargo type before and after the operation must be the same. Therefore when the ‘Before’ switch is toggled to ‘After’, the cargo type drop down is disabled.

The switch next to ‘Before’ is used to toggle between loading and discharging. This setting can only be changed when the first tank and ‘Before’ are selected.

In our example we make sure that the switches are set to ‘Before’ and ‘Loading’ (this is the default setting when you create a new report).

The next switch is for selecting whether slops have been sampled or not. If you select ‘No’, a field will appear where you can state a reason, such as ‘not requested by client’ or ‘not applicable’.

Below this we will find all the data pertaining to this tank ‘Before loading’ and we can now fill this out. We know from the pre-loading report that the inspection was finished on 22/7/18 at 0936 hrs, so we can fill in the same data here, together with the data for the ROT tank: ullage, total volume, free water dip (or interface ullage), free water volume, if necessary temperature, density and Alpha, Temp for density.

Disclaimer text: if we leave this empty and we have entered a disclaimer text in Report settings, that disclaimer will be printed on the report. Otherwise the disclaimer entered here will be printed.

Below is an example of our slop report on arrival. As you can see the ‘After loading’ section is still completely empty, except for the density used.

Upon completion of loading the ROT tank will be inspected again, and then the remaining data can be entered and the full report can be issued:

Slop report - products

A note on the cargo type: if we select ‘Chemicals’ instead of any of the other cargo types, the layout of the report will be slightly different: the GSV will be noted as ‘N/A’ because many of the chemicals (such as vegetable oils / FAME) have a density stated at 60ºC and the cargo would be solid at 15ºC. The below picture shows the difference.

Slop report Chemicals


This is the end of part 3 of this tutorial; in part 4 we will discuss the arrival bunker report. In the mean time, for those who are interested in Cargo Surveyor for Android: the app can be downloaded here:

google-play-badge


We post updates for the app in Google Play frequently to solve minor bugs, and advise all users to update as soon as a new update is available; we don’t use advertisements in Cargo Surveyor and we never will.

If you have any queries, suggestions, comments, criticism about the app or this blog post, please let us know! We always do our best to accommodate any requests for additions/modifications to our apps if they improve the value!


New Android app – Visco Temp(for free from 21st until 28th June)

Yesterday we published ‘Visco Temp’ on Google Play.

This is another standalone version of the same utility included in Oil Calculator Pro.

The visco temp app calculates (for fuel oils) an alternative temperature at a given viscosity or an alternative viscosity at a given temperature, on the basis of an initial viscosity and temperature, or on the basis of two sets of (viscosity, temperature) data.

Starting today 21st June Visco Temp is available for download for free until 28th June, thereafter it will be available at its regular price of USD 2.


NOTE: THIS APP HAS BEEN REMOVED IN ORDER TO COMPLY WITH GOOGLE PLAY POLICIES

google-play-badge

You can download ‘Visco Temp’ here.


Visco Temp uses two methods to calculate alternative temperature and viscosity: the ‘V50’ formula and the ‘Walther’ equation. Depending on which method is used, a graph is drawn upon entering the required inputs, and there are fields available for entering an alternative viscosity and temperature, which when entered with data will give the resulting temperature or viscosity:

Visco Temp

Available controls and fields:

Temperature toggle buttons:

The temperature can be entered in either °Celsius or °Fahrenheit, depending on the state of the toggle buttons. There are three areas where the user can enter temperature and in each area the temperature unit can be set independently. When the user toggles the button, any existing values are automatically converted.


Viscosity fields:

The viscosity is entered in centi Stokes (cSt). The upper half of the screen is basically divided into two portions: one portion for using the ‘V50’ formula, which is marked by ‘Using one reference only’, and one portion for using the ‘Walther’ equation, which is marked by ”Walther equation (using 2 reference points’)’.


Visco Limit:

The maximum viscosity displayed in the graph can be set using this button. When pressed, a list of possible viscosities shows up (500, 1000 etc) and once the user presses the desired limit, the graph is updated accordingly:

Set viscosity limit


Show V50:

This is a toggle button that switches between displaying the graph using the V50 formula and the Walther equation. If no data is present in the V50 area, the graph will not show, and likewise for the Walther area.


Options menu:

The options menu (in the upper right hand corner of the screen on newer phones), allows the user to go to the ‘About’ screen, and also it allows the user to set the ‘theme’ for the graph. There are six possible themes, 3 with a black background and 3 with a white background:

Select theme for graph


Example – V50 formula:

If we enter a temperature of 50 °C and a viscosity of 380 cSt in the V50 area, as shown in the above picture, and then enter a temperature of 35 °C in the alternative temperature field (below the second temperature toggle button) we can see that the corresponding viscosity is  1089.8 cSt. Conversely if we would enter a viscosity of 200 cSt, we will see that the corresponding temperature is 60.9 °C.

Example – Walther equation:

If we enter a temperature of 38°C and a viscosity of 800 cSt for T1 and V1, and a temperature of 60°C and a viscosity of 200 cSt for T2 and V2, as shown in the above picture, and then enter a temperature of 50 °C in the alternative temperature field (next to the third temperature toggle button) we can see that the corresponding viscosity is  357 cSt. And if we enter a viscosity of 380 cSt, we will see that the corresponding temperature is 49 °C.


google-play-badge

You can download ‘Visco Temp’ here.


Cargo Surveyor for Android – Tutorials part 2: OBQ report

The tutorials part 2 for the Android version of Cargo Surveyor deals with the OBQ report.

Recently we discussed the first document of the set of documents required to be produced in the load port, the pre-loading report.

Today we will discuss part 2 of the tutorials, which will deal with the OBQ report:

Upon completion of the tank inspection, we can enter our dips and wedge volumes in the OBQ report editor, and generate the report accordingly.

To get to the OBQ report editor we first need to go to the list of reports (‘Pdf/jpg Reports’), which can be accessed by pressing the options menu button (on newer phones this in the top right hand corner of the screen); this options menu is available from within:

  • the first screen when you open the app
  • the tank configuration screen for standard layout
  • the tank configuration screen for extended layout

Options menu to report list

After pressing the option ‘Pdf/jpg Reports’, the list of available types of reports appears. If you accessed this from the very first screen, a message comes up first, asking you to confirm whether to use standard or extended layout for ullage reports. For OBQ reports you can choose either, it makes no difference. The choice between extended and standard layout is only important for ullage reports and transfer summary reports:

Pdf reports listChoose layout

After selecting ‘EXTENDED’ or ‘STANDARD’ (if applicable), from the list above you select ‘ROB/OBQ reports’, and this will bring you to the list of available ROB/OBQ reports. If this is the first time that you are going to create a OBQ report, the list will show only one entry: ‘Create new entry’:

ROBOBQ report no entries

After pressing the ‘Create new entry’ line in the list, you will be asked to enter a title for the report, we can simply use our ‘Testship’ as title:

Create testship OBQ report

Once you press ‘OK’, the ROB/OBQ reports list shows the new entry ‘Testship’. The here described process for accessing the pdf/jpg reports, and for creating a new pdf/jpg report is the same for all the reports except for the ullage report and transfer report; the ullage report is created from within the STANDARD and EXTENDED tank layout. The transfer report is created based on the selection of two existing ullage reports. More on this in future tutorials.

Now if you select the ‘Testship’ entry, the OBQ reports editor appears if you select ‘Load/Edit data’ from the list of available actions:

testship OBQ report created

OBQ report editor

When we first open this editor, ship name, port, date and cargo name will already have been filled in if we entered this information in the report settings, as discussed in part 1 of this tutorial.

We now first need to select whether this is an OBQ or an ROB report using the switch in the top of the editor (in the picture on the left the switch is already set to OBQ report). The difference between the two reports is that in OBQ report there is an entry for water dip / volume as well as for oil, whereas in the ROB report the entry for water dip/volume is missing.

Draft (in our example arrival drafts) and list if applicable can be entered, and we select either ‘Yes’ or ‘No’ for the question ‘Lines drained?’. Lines drained is actually not applicable for the OBQ report, it will be ignored in the actual report. It is only used for the ROB report.

Next down you can see the tank number drop down, which shows initially ‘1’. Below this tank drop down there is a drop down for choosing the innage units, either ‘Meters’ or ‘Ft, Inches’, and below that you can enter the tank name or number (such as ‘4C’, ‘1P’ etc). There is also a drop down for choosing between M3 and Bbls as volume unit. You can only switch between units when the first tank is selected.

You can either enter all tanks that were inspected, whether they were empty or not, or limit the report to tanks that actually contain OBQ. If you don’t fill in any information in the fields below the tank number drop down, and leave the tank name of the first tank as ‘1’, then the report will show just one line with tank data, and this line will simply be empty. The total amount of OBQ will also be shown as zero.

Alternatively you can make an entry for each individual tank and specify dips and wedge (or table) volumes as necessary. When you need to add a tank to the list, first make sure that you have given the desired name to the first tank, and then press the ‘+’ button.

A new entry will now be generated, which you can edit by selecting it in the drop down. In our current example, lets say that you named the first tank ‘1P’; as soon as you have changed the tank name on the first tank, this change will be reflected in the drop down, it will now show ‘1P’ instead of ‘1’. Now if you press the ‘+’ button, a message comes up saying ‘Tank (no. 2) added’. If you now press the drop down, you will see two entries in the list: ‘1P’, and ‘2’.

In order to edit the details for the 2nd tank, just press on ‘2’ in the list. If you had entered any details for the first tank, such as innage and wedge volume, these fields will now be empty and you can enter the correct data for this tank.

As you can see in the picture on the left, there are three fields for entering oil volume: Non liquid, Liquid(table) and Liquid(wedge). You only need to enter one liquid volume, either table or wedge. If you need the wedge volume you can press the ‘Wedge formula’ button to jump to the wedge formula tool to calculate the volume.

Below the entries for oil there are also two fields for water dip and volume.

You can mix table and wedge volumes for different tanks, the app will automatically calculate the totals of all three for all tanks. For each tank you also enter a remark if necessary.

Disclaimer text: if you have entered a disclaimer text in Report Settings, then that disclaimer will be used in the report instead of the disclaimer entered in the OBQ report editor.

An example of the completed OBQ report is shown here below:


OBQ report

This ends this tutorial. In part 3 we will discuss the Slop report.

In the mean time, for those who are interested in Cargo Surveyor for Android: the app can be downloaded here:

google-play-badge


We post updates for the app in Google Play frequently to solve minor bugs, and advise all users to update as soon as a new update is available; we don’t use advertisements in Cargo Surveyor and we never will.

If you have any queries, suggestions, comments, criticism about the app or this blog post, please let us know! We always do our best to accommodate any requests for additions/modifications to our apps if they improve the value!


Cargo Surveyor for Android – Tutorials part 1: pre-loading report

As promised last week, we are starting a series of tutorials for the Android version of Cargo Surveyor.

Each tutorial will discuss specific features of the app, and explain how to go about setting up reports, what settings need attention and so on.

Part 1 of the tutorials will deal with the load port and specifically with the pre-loading report:

First thing to do is check that general settings and pdf settings in our app have been selected according to our needs:

In general settings, we select ‘SI Metric’ and ‘ASTM 2004’ since that is the standard used in most European ports:

General settings Cargo Surveyor appWe will briefly discuss here all general settings:

In the top half of the screen there are precision settings for VCF, GSV, MTons, LTons and Bbls/Gallons; The VCF is rounded by default based on whether the 1980 or the 2004 version of the ASTM tables have been selected, but you can also choose a rounding manually, using the dropdown on the right hand side.

When using the 1980 tables the VCF is rounded to 4 decimals (unless you override this with a number of your own choice), whereas when the 2004 tables are selected the VCF is rounded by 5 decimals.

In “Other settings’ we find the following:

– Notifications  show all: this is for trouble shooting purposes and should be left unchecked normally.

– SI Metric / Imperial: this is the most important setting of all; if you select SI Metric, VCF calculations for crude will be carried out using table 54A, whereas if you select Imperial, table 6A will be used. The same goes for products (table 54B and table 6B), Luboils (table 54D and table 6D) and Special applications (table 54C and 6C).

This setting directly affects how your reports are printed: if for example you have created an ullage report using SI Metric units but wish to print it using Imperial units, then simply select Imperial when you go to pdf reports. More on this later.

– Use T52(1980) / Use T52(2004): when ASTM 1980 is selected, T52(1980) is selected and T52(2004) is disabled. When you select ASTM 2004 you have however the option to use either of them.

– Use Table  56 / Use Dens – 11: although using density – 11 points for the calculation of metric tons in air is a shortcut (Table 56 is the official approach), in some countries it seems to be preferred to use density – 11 points which is why this option is here. This option is only applicable when using SI Metric tables, regardless of whether ASTM 1980 or 2004 is used.

– ASTM 1980 / ASTM2004: whether to use the old (1980) ASTM tables or the new (2004) version of the tables. There is a significant difference in calculation method of the VCF between the two tables and while the numeral difference between the VCF calculated at either table is not all that big (depending on the density and temperature around or less than 0.0001), when dealing with large quantities the difference in quantity can amount to more than a few tons.

– Reset to default: if you press this button, all settings revert to their defaults, being:

  • ASTM 1980
  • SI Metric
  • Use dens – 11
  • VCF: 4 decimals
  • MTons: 3 decimals
  • LTons: 2 decimals
  • Bbls/Gallons: 0 decimals

In the pdf report settings we can enter the ship’s name, arrival draft, port, date and cargo name. We can also select the activity (‘Before Loading’), and enter our Company’s legal disclaimer if we haven’t done that yet.

Pdf report settings for Cargo Surveyor

Pdf report settings


Let’s go through all settings one by one to clarify a few things:

– Set Logo button: If you press this button, a file browser window opens up and you can select a logo (jpg) file. The size does not really matter. The image will automatically be adjusted to fit in the image square.

– Camera: alternatively you can take a picture with the camera on your phone and use that as a logo.The logo will be printed in the upper left corner on all pdf reports. The first time that you opt to use your camera, the app will ask you for permission to access the camera.

– Company header: generally the name of your company. You should limit the amount of text to what you can see on the screen, to ensure that it fits in the header on the pdf reports.

All text fields where nothing has been entered yet, show a hint in red color; any text that has been entered by the user is in yellow.

– Surveyor: name of the surveyor.

– Master / CO: name of captain, or chief mate etc.

– Cargo name: name of the current cargo (to be loaded or discharged etc).

– Port: the current port as you wish it to appear in the report.

– Date: the date that you wish to appear on your report.

We can also enter any email addresses (or take them from the Contacts), that we wish to send our reports to.

The format of our reports will be ‘pdf’, this is the default setting on Android phones which run on Kitkat or higher.

Any text fields that are empty have a hint text shown in red color.

– Cargo Activity: the buttons ‘Before’ and ‘Loading’ let you choose between ‘before’ and ‘after’ and ‘loading’ and ‘discharging’. This setting will be reflected in the header in ullage reports. (more on that in the tutorial about ullage reports).

– Mother or daughter vessel: in case the vessel is doing an STS operation, the name of mother of daughter vessel can be entered here.

– Draft: you can enter 4 drafts: aft – forward and port – stbd. These are also used in ullage reports.

– Email recipients: you can enter a maximum of 4 email addresses that will automatically be included in reports that you send by email. You can either press the ‘Contacts’ button and choose a recipient using your contacts, or enter email addresses manually. The first time that you opt to use your contacts, the app will ask you for permission to access contacts.

– Keep ullages in original units: this will prevent ullages from being converted; if your report is using SI Metric units but the ship that you are attending only has tank tables in feet and inches, then you can enter your ullages in feet and inches while using the SI Metric setting, and your ullage report will be generated using SI Metric settings without converting the ullages into metric units.

– Preferred ullage report format: this is applicable to all reports actually. The format of our reports will be ‘pdf’, this is the default setting on Android phones which run on Kitkat or higher. When the pdf report is generated, it is automatically saved in the internal storage of the phone. If the jpg format is selected (or if the phone’s Android version is below Kitkat), the generated jpg file will be automatically saved in a directory called ‘saved_images’.

In load port:

Let us assume that the vessel (‘TestShip’) has arrived in Amsterdam for loading a cargo of Mixed Aromatics. The Vessel’s last cargo was 50 ppm Gasoline PU50, second last cargo was JET A1 and third last cargo was JET A1. All cargo tanks are full “Pure Epoxy” coated. The cleaning method was: ‘well drained’. The cargo is destined as ‘Mogas Blend Stock’.

The following reports will be required on arrival before loading:

  • Pre-loading report
  • OBQ report
  • Slop report
  • Bunker report
  • VEF report

Once the ship has completed loading, the following reports are required:

  • Ullage report
  • Bunker report
  • Slop report
  • Transfer executive summary (loading)
  • Sampling report
  • Master’s receipt of samples report
  • Time sheet
  • Ref heights / raw measurements report
  • Any NOADs / SOF as required

Pre-loading Report:

Pre cargo matrix


Using the Pre-Cargo Matrix we can first establish whether the ship’s tanks are suitable for loading the nominated cargo basis the tank cleaning requirements and actual tank cleaning done. You can find the Pre-Cargo Matrix utility in the very first screen of the app; when you press the options menu (on newer phones this is the three vertical dots on the upper right hand corner of the screen), you will find it there.

Using the pre-cargo matrix module, we select ‘UN1203 50 ppm – Gasoline PU50, SU50 ULG’ as the ‘From’ entry, and ‘UN3295, Platformate Reformaten Mogas or Chem’ as the ‘To’ entry.

As can be seen in the screenshot on the left, the next cargo is NC (not compatible) if the cargo is destined to be Chemical Feed Stock, but if destined as Mogas Blend Stock it is compatible, provided that the cargo tanks are well drained as defined in the definition shown below the compatibility field.

It is also stated here that any ROB volume in excess of 0.05% of the individual tank capacity does not meet the well drained criteria.

Next step is to carry out the tank inspection to verify that tanks, pump columns and pipe lines are well drained. The pre-loading report will be compiled on the basis of the findings in the course of the tank inspection.

Upon completion of the tank inspection we have concluded that all tanks and lines have been well drained, and we can therefore mark all cargo tanks using the appropriate letter (A in this case).

Any tanks that would have failed the inspection would have been marked ‘X’, and this will have resulted in a remark appearing in the pre-loading report stating that ‘the following tanks were found to be unsuitable for loading:’.


To get to the Pre-loading report editor we first need to go to the list of reports (‘Pdf/jpg Reports’), which can be accessed by pressing the options menu button (on newer phones this in the top right hand corner of the screen); this options menu is available from within:

  • the first screen when you open the app
  • the tank configuration screen for standard layout
  • the tank configuration screen for extended layout

Options menu to report list

After pressing the option ‘Pdf/jpg Reports’, the list of available types of reports appears. If you accessed this from the very first screen, a message comes up first, asking you to confirm whether to use standard or extended layout for ullage reports. For Pre-loading reports you can choose either, it makes no difference. The choice between extended and standard layout is only important for ullage reports and transfer summary reports:

Pdf reports listChoose layout

After selecting ‘EXTENDED’ or ‘STANDARD’ (if applicable), from the list above you select ‘Pre-loading reports’, and this will bring you to the list of available Pre-loading reports. If this is the first time that you are going to create a Pre-loading report, the list will show only one entry: ‘Create new entry’:

Preloading report editor no entries

After pressing the ‘Create new entry’ line in the list, you will be asked to enter a title for the report, we can simply use our ‘Testship’ as title:

Preloading report testship created

Once you press ‘OK’, the Pre-loading reports list shows the new entry ‘Testship’. The here described process for accessing the pdf/jpg reports, and for creating a new pdf/jpg report is the same for all the reports except for the ullage report and transfer report; the ullage report is created from within the STANDARD and EXTENDED tank layout. The transfer report is created based on the selection of two existing ullage reports. More on this in future tutorials.

Now if you select the ‘Testship’ entry, the Pre-loading reports editor appears if you select ‘Load/Edit data’ from the list of available actions:

Slop selecting testship


Preloading report editor

In order to complete the Pre-loading report we have to fill in the time of completion of the inspection, the cargo tank history and the method of cleaning used for each tank.

Once we have created a new report (with the name ‘Testship’ for example), the screen will open with just one tank named ‘1’. We enter ‘1P’ for the tank number, and fill in the name of the cargo to load, the last cargo and the 2nd last / 3rd last cargo, as well as the coating in this tank.

The default selected cleaning method is always ‘A’ (tanks lines etc completely drained), and since this is the method used on ‘Testship’ we will leave it like that.

We can also select ‘Yes’ for ‘Inert Gas In Operation’, and ‘Vapor locks’, while ‘IG released for inspection’ remains ‘No’.

Now we press the ‘+’ button to create a new entry. You will notice that the information under cargo tank history has been copied to the new tank, for convenience purposes. If the tank has a different history, or a different cargo to load etc, all we need to do is update the applicable fields.

The only thing we need to do now is change the tank name to ‘2P’, then press the ‘+’ button again to create a new tank etc, until we have completed the entries for all tanks (in this case ‘Testship’ has 6 pairs of wing tanks plus 2 slop tanks).

Once we are done we can return to the list of preloading reports, press our newly created report ‘Testship’ and select ‘View pdf’ (or ‘View jpg’, if your phone is not capable of generating pdf files).

After pressing the back button, the app will ask if you wish to send the report by email and it will also ask if you wish to export the file to csv, and if you wish to send the csv by email if you opt to export.

If you press ‘View pdf’ again in future, the app will ask you if you wish to overwrite the file, since it exists already.

You can see an example of the pre-loading report below:


Pre loading report p1

Pre loading report p2

The below picture shows page 2 of the Pre loading report in case of one or more tanks are not suitable for loading:

Pre -loading report p3

This is the end of part 1 of this tutorial; in part 2 we will discuss the OBQ report. In the mean time, for those who are interested in Cargo Surveyor for Android: the app can be downloaded here:

google-play-badge


We post updates for the app in Google Play frequently to solve minor bugs, and advise all users to update as soon as a new update is available; we don’t use advertisements in Cargo Surveyor and we never will.

If you have any queries, suggestions, comments, criticism about the app or this blog post, please let us know! We always do our best to accommodate any requests for additions/modifications to our apps if they improve the value!

New Android app – Visco Blender (for free from 19th until 26th June)

Yesterday we published ‘Visco Blender’ on Google Play.

This is another standalone version of the same utility included in Oil Calculator Pro.

The visco blender calculates a blend of maximum ten components, and actually calculates not only the viscosity but also the pour point, flash point and density of the resulting blend.

google-play-badge

You can download ‘Visco Blender’ here.


All data entered is stored into a local database and will be saved automatically so that the user can later easily retrieve and edit the information again. There is however only one set of data available, at present it is not possible to save multiple blend configurations under different names.

The visco blender contains two tools: one is the actual blender tool as described above, the other one is a simple fraction calculator, which will be explained further below.

Visco blender


Available controls and fields:

Component number:

This is a drop down list numbered from 1 to 10 and is used to select a specific entry. When you select another entry, any data that has been entered in the current entry is saved; thereafter any existing data for the newly selected entry is loaded into the display.

M³, Mtons and density:

If the user enters a volume and a density, the weight is calculated automatically. Conversely if you enter a weight and a density, the volume is calculated automatically. Units used for these entries depends on whether you have selected SI Metric or Imperial using the options menu: all data is stored in the database in SI Metric form, but is displayed in Imperial units if Imperial units has been set in the settings screen, and values of density and volume are automatically converted accordingly.

Viscosity:

The viscosity is entered in centistokes (cSt) regardless of which unit has been chosen in settings. The resulting blend viscosity is also calculated and displayed in centistokes.

Flash point and pour point:

Flash point and pour point are entered either in °C or °F depending on the unit setting. As with volume and density, the flash point and pour point are stored in the database in °C, and the resulting flash and pour point are calculated in °C, but are displayed according to the unit setting chosen in the settings screen.

Fraction calculator:

The fraction calculator calculates the respective quantities of two components, based on their individual viscosities and the required target viscosity. The user simply has to enter the total quantity, target viscosity and the viscosity of each component, and the app then calculates the required quantity for each component using the Refutas method to reach the target viscosity.

Change settings:

There is an options menu in the top right hand corner of the screen (for newer phones; for older phones the options menu can be accessed using a hardware menu button). When you press this menu, two options show up: the option to switch between SI Metric and Imperial units, and the option to view the ‘About’ screen:

Options menu

In below screen shot you can see the difference between using Imperial units and SI Metric units:

Comparing metric and imperial

google-play-badge

You can download ‘Visco Blender’ here.


Free Android app – Wedge Calculator

Two days ago we published ‘Wedge Calculator’ on Google Play.

This is another free standalone version of the same utility included in Tank Totals and Cargo Surveyor.

The app calculates the ROB quantity in cargo tanks basis tank dip and trim.

Wedge calculator can calculate wedges both using the cargo tank dimensions and basis ship’s tank calibration tables.

Wedge empty

google-play-badge

You can download ‘Wedge Calculator’ here.


The wedge calculator can be used to calculate ROB or OBQ based on tank dips taken. The calculation is done either based on the dimensions of the tank, or based on the volume as per the tank calibration table.

The wedge volume is calculated continuously, as the user inputs data.

Data can be entered either in SI Metric or Imperial units.

When the user enters any data, this data is stored in the app’s settings so that the next time the user opens the app, that data is still available. When you enter new data however, the previously stored data is overwritten with the new data.

When a text field is cleared, it shows the required unit to be used, for example in SI Metric mode centimeters are used for the tank sounding and meters for all other distance units, as shown in the picture above.

The options menu contains two items: “Clear all fields”, which does just that, and a link to the about screen.

Required entries:

The following parameters are required to be entered:

  • Distance to aft bulkhead, ship’s length between perpendiculars, trim, reference height: these can all be found in the tank calibration tables.
  • Tank width and length: can be measured off the general plan if not available in the tank calibration tables.

If you have chosen to use the tank calibration table volume as a base volume for the calculation, you need to look up the volume corresponding to the tank dip, without trim correction, and enter this as Table Volume in the app.

In both cases the wedge calculator calculates the wedge volume and checks if the wedge formula is applicable, i.e. if the length of the wedge is smaller than the length of the tank.

Options:

There are two options in the wedge calculator:

1: As mentioned above, entries can be made either using SI Metric units or Imperial units.

After entering all data using one standard, if you change from say SI Metric to Imperial, all existing data is automatically converted to the newly selected standard.

2: The choice to use either tank calibration table volume or tank dimensions for calculating the wedge.

In the above picture you can see the difference between SI Metric and Imperial units setting.


google-play-badge

You can download ‘Wedge Calculator’ here.


Free Android app – Bottom Lines Calculator

Yesterday we published ‘Bottom Lines’ on Google Play.

This is the free standalone version of the same utility included in Tank Totals and Cargo Surveyor.

The app calculates the bottom line(s) quantity to add to or deduct from a grade, if bottom line quantities have been included in the tank volumes in the ship’s tank calibration tables.

This is especially important on VLCC and Suez max tankers, where the bottom line quantities are in the order of around 300 M³.

google-play-badge

You can download ‘Bottom Lines’ here.

How to use:

Table of line contents

1. Enter names for the grades of cargo on board. A maximum of five grades can be entered. In below example three grades have been entered: rmg, rmk and m100.

2. Select a grade for each bottom line, and tick the check box on the right hand side if the line is full.

3. Obtain bottom line section quantities from the ship’s tank calibration tables. Press the ‘Line Qty/Section’ button and enter the line quantities according to the table of line content (see above picture).

4. Return to the main screen and press the ‘Set grade for tanks’ button and select the grade for each tank. Tanks that are empty should be left as such (marked ’empty’):

5. Return to the main screen and the quantity to add to / deduct from each grade is now shown. If you change the grade for a bottom line these quantities are immediately updated.

Keep watching this space for more free apps! Our next free app (Wedge calculator) will be published soon!

google-play-badge

You can download’Bottom Lines’ here.