This tutorial deals with the Transfer executive summary report.
In the previous tutorial we discussed the updated ullage report, and the different options that are available to us to tailor the ullage report to our specific requirements.
Today we will discuss the updated version (1.6.4) of the transfer executive summary report:
In the previous session concerning the ullage report we completed generating an ullage report using Extended Layout, and we discussed how to generate the ullage report with various options, send it by mail and export it to csv.
Once a cargo operation is completed, we can use the transfer executive summary utility to:
- Calculate cargo discharged or loaded (in the case of part discharge, and in case of loading multiple parcels)
- Calculate comparisons between ship received / shore supplied, or in case of STS operations mother / daughter discharged / received
- Calculate comparisons between Bill of lading figures and ship discharged, or Bill of lading figures and ship received
NOTE: an update to the app was published on Saturday (July 11th), fixing a bug that caused GSV and weights to show incorrectly under certain circumstances.
To get to the Transfer report editor we first need to go to the list of reports (‘Pdf/jpg Reports’), which can be accessed from the ‘More’ tab, press the ‘Reports’ button and then select ‘Txfer Reports’ from the list of available reports.

Select Txfer Reports from the list
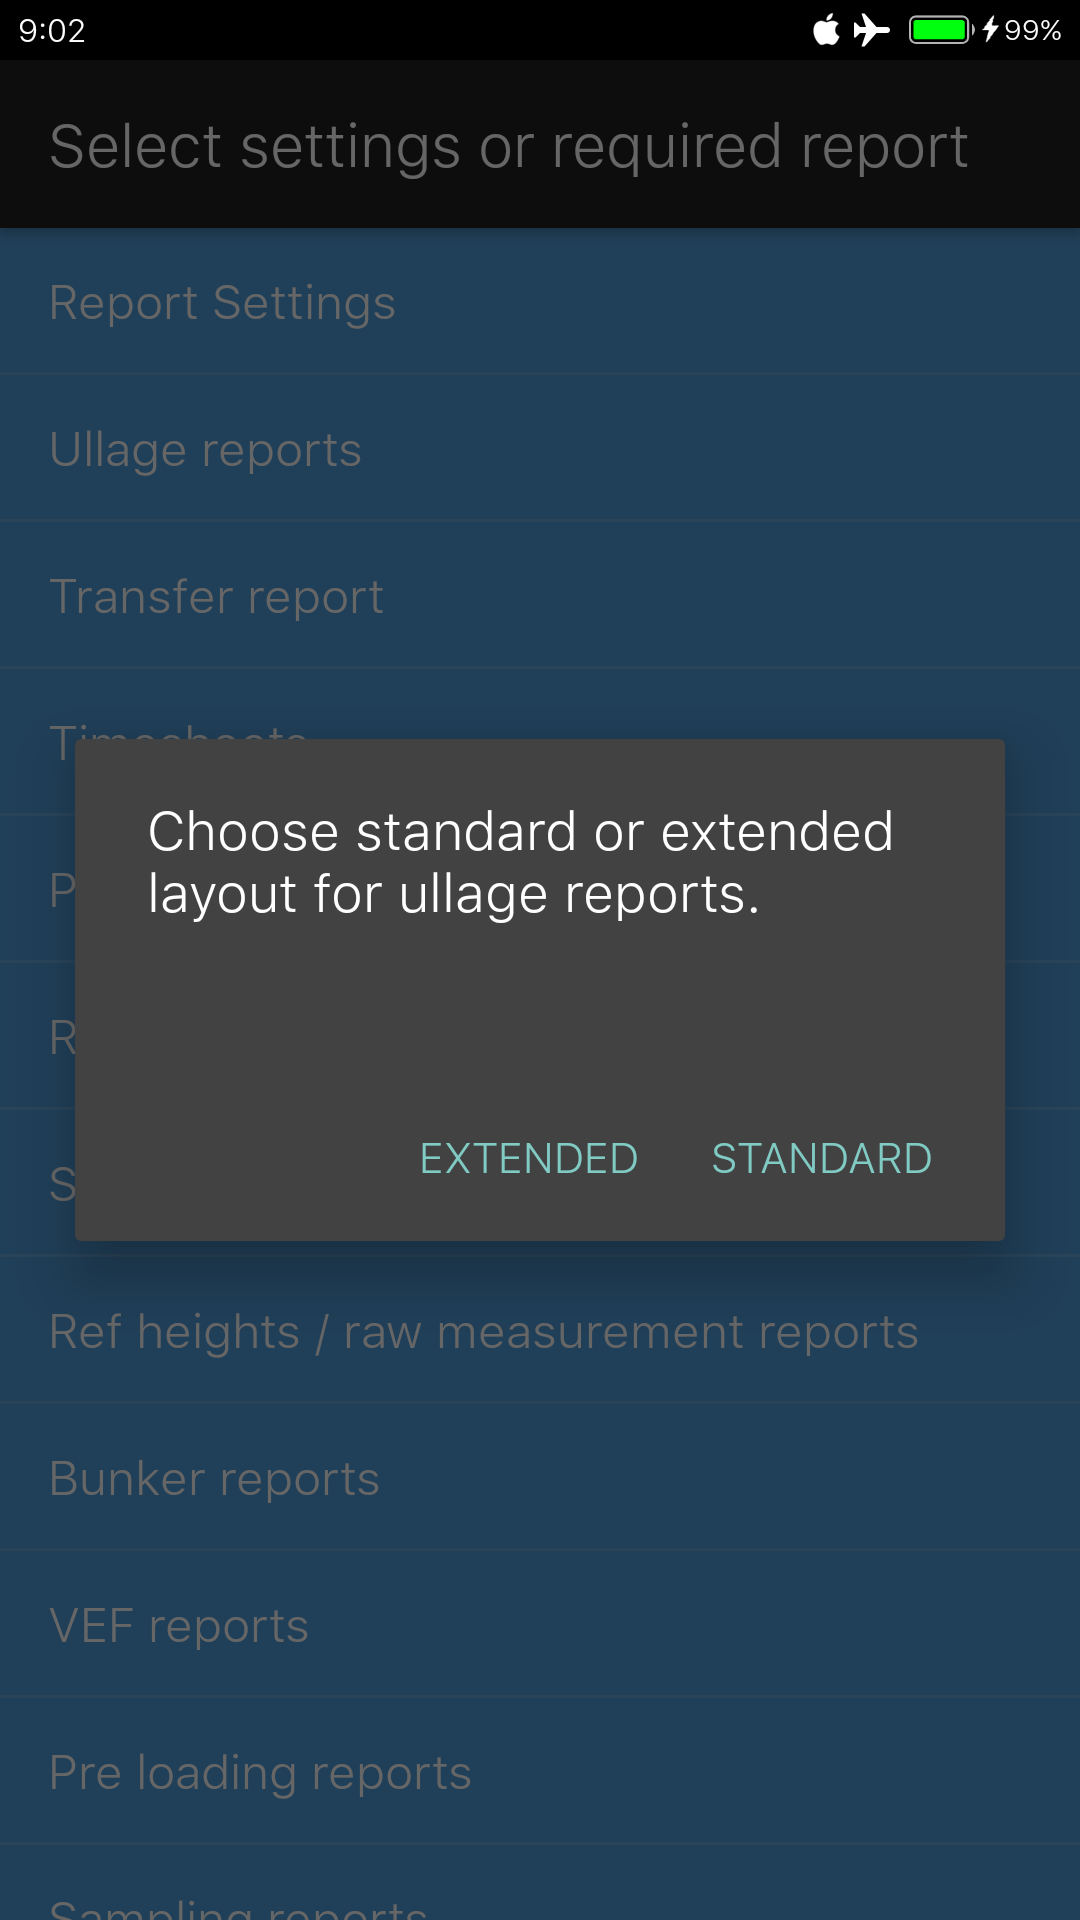
This will bring you to the Transfer Summary Editor. A dialog is shown initially to let you choose between Standard and Extended Ullage reports for the summary:
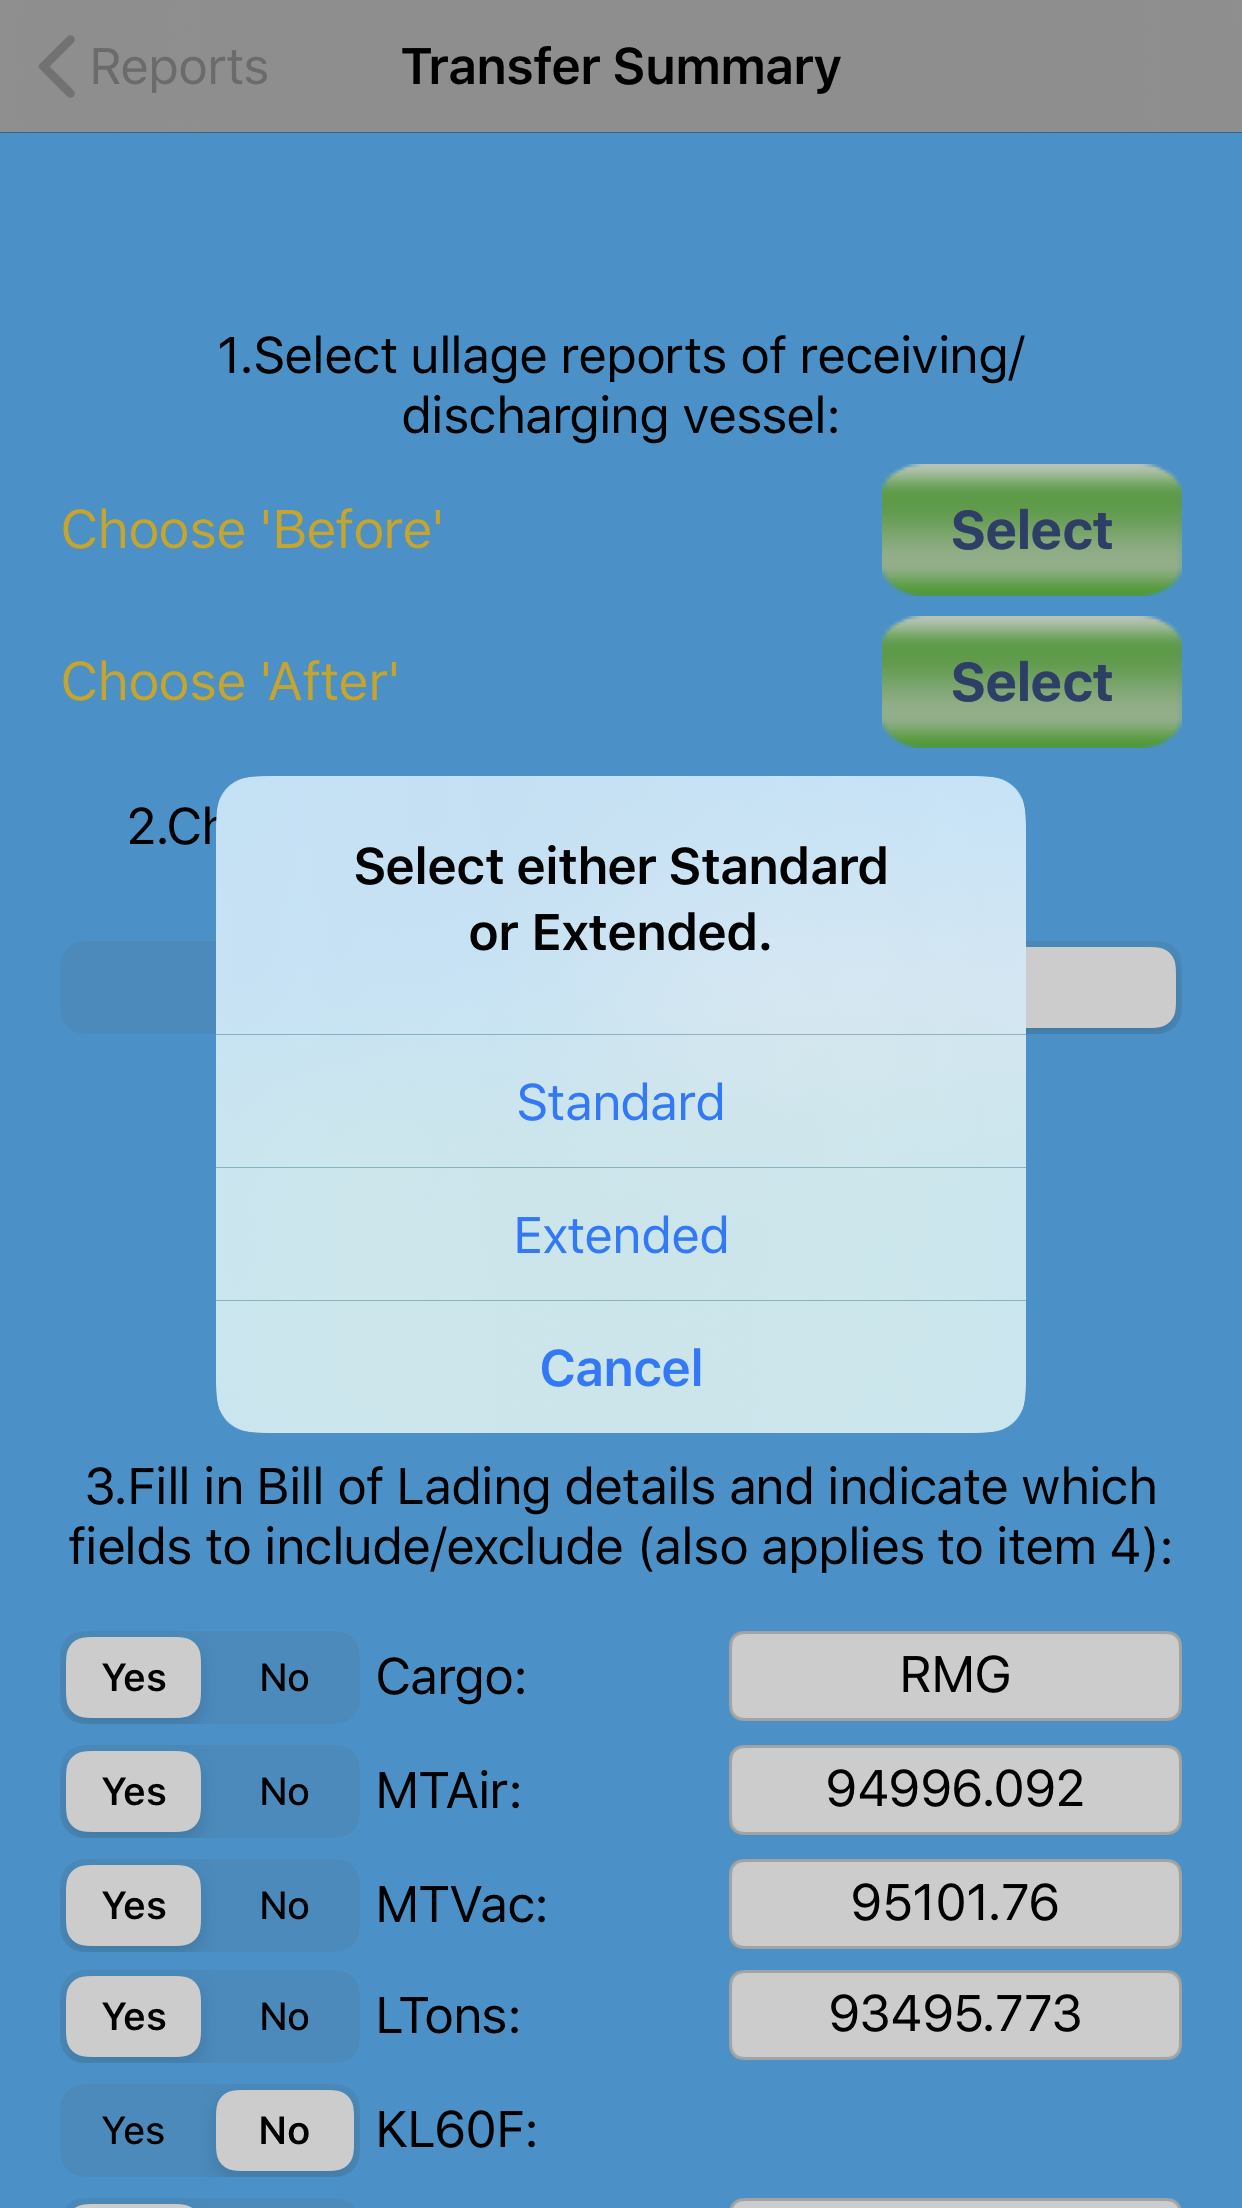
Choose Extended or Standard Layout
For this exercise we will select Standard Layout. Once the selection is made, the dialog disappears, and you will see that the ‘View Summary’ and ‘View Pdf’ buttons are disabled. They will only be enabled once you have selected both an ullage report for before and after the operation.

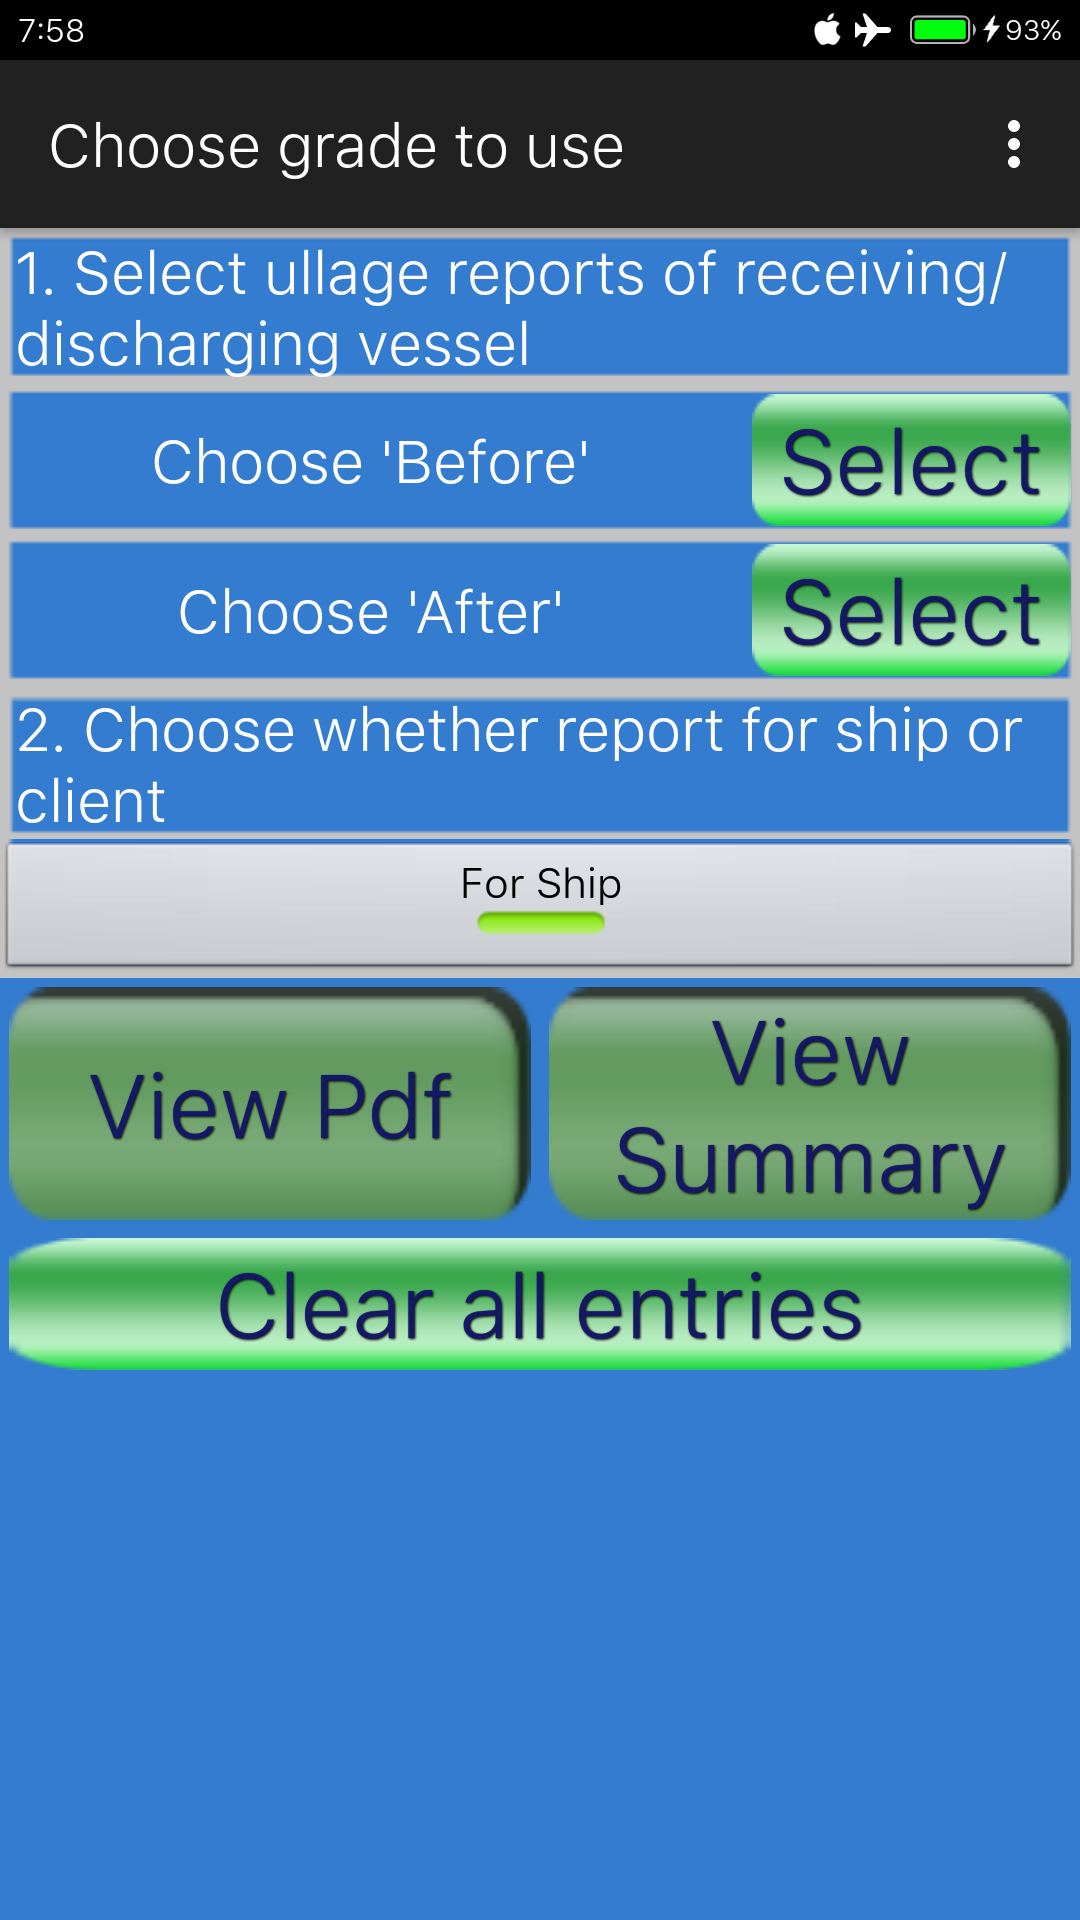
Above the two buttons ‘View Summary’ and ‘View Pdf’ there is a switch for selecting whether the report is for the ship, or for the client; the difference is that if the report is ‘For Ship’, it will simply list the quantities before and after the operation and the total quantity loaded or discharged. If the report is ‘For Client’, aside from the quantities before and after the cargo operation, comparisons are shown between Bill of Lading and transferred quantity, and quantity transferred to or from terminal or other vessel (in case of STS). Also in case of STS, VEF corrected transferred quantities are calculated and shown.
In the older versions (pre 1.6.2) there was no option to insert a bill of lading date, and record the VEF for mother and daughter vessel in case of STS.
For each unit MTAir / MTVac / LTons etc you can choose whether the value should be printed or not. The setting ‘Apply VCF to totals only’ in general Settings applies here just like in ullage reports: if this is set to Yes, GSV will be calculated basis total net GOV corrected for average temperature instead of calculating GSV for each tank.
Inside the editor you can select the two ullage reports to use for producing the transfer report. When you press ‘Select’ next to the ‘Choose Before’ label, the list with available ullage reports will appear. You can select the one you want to use, choose whether you want to use the totals of all grades or one particular grade, and after that the name of that ullage report appears instead of the ‘Choose Before’ text. The same goes for the ‘Choose After’ selection:

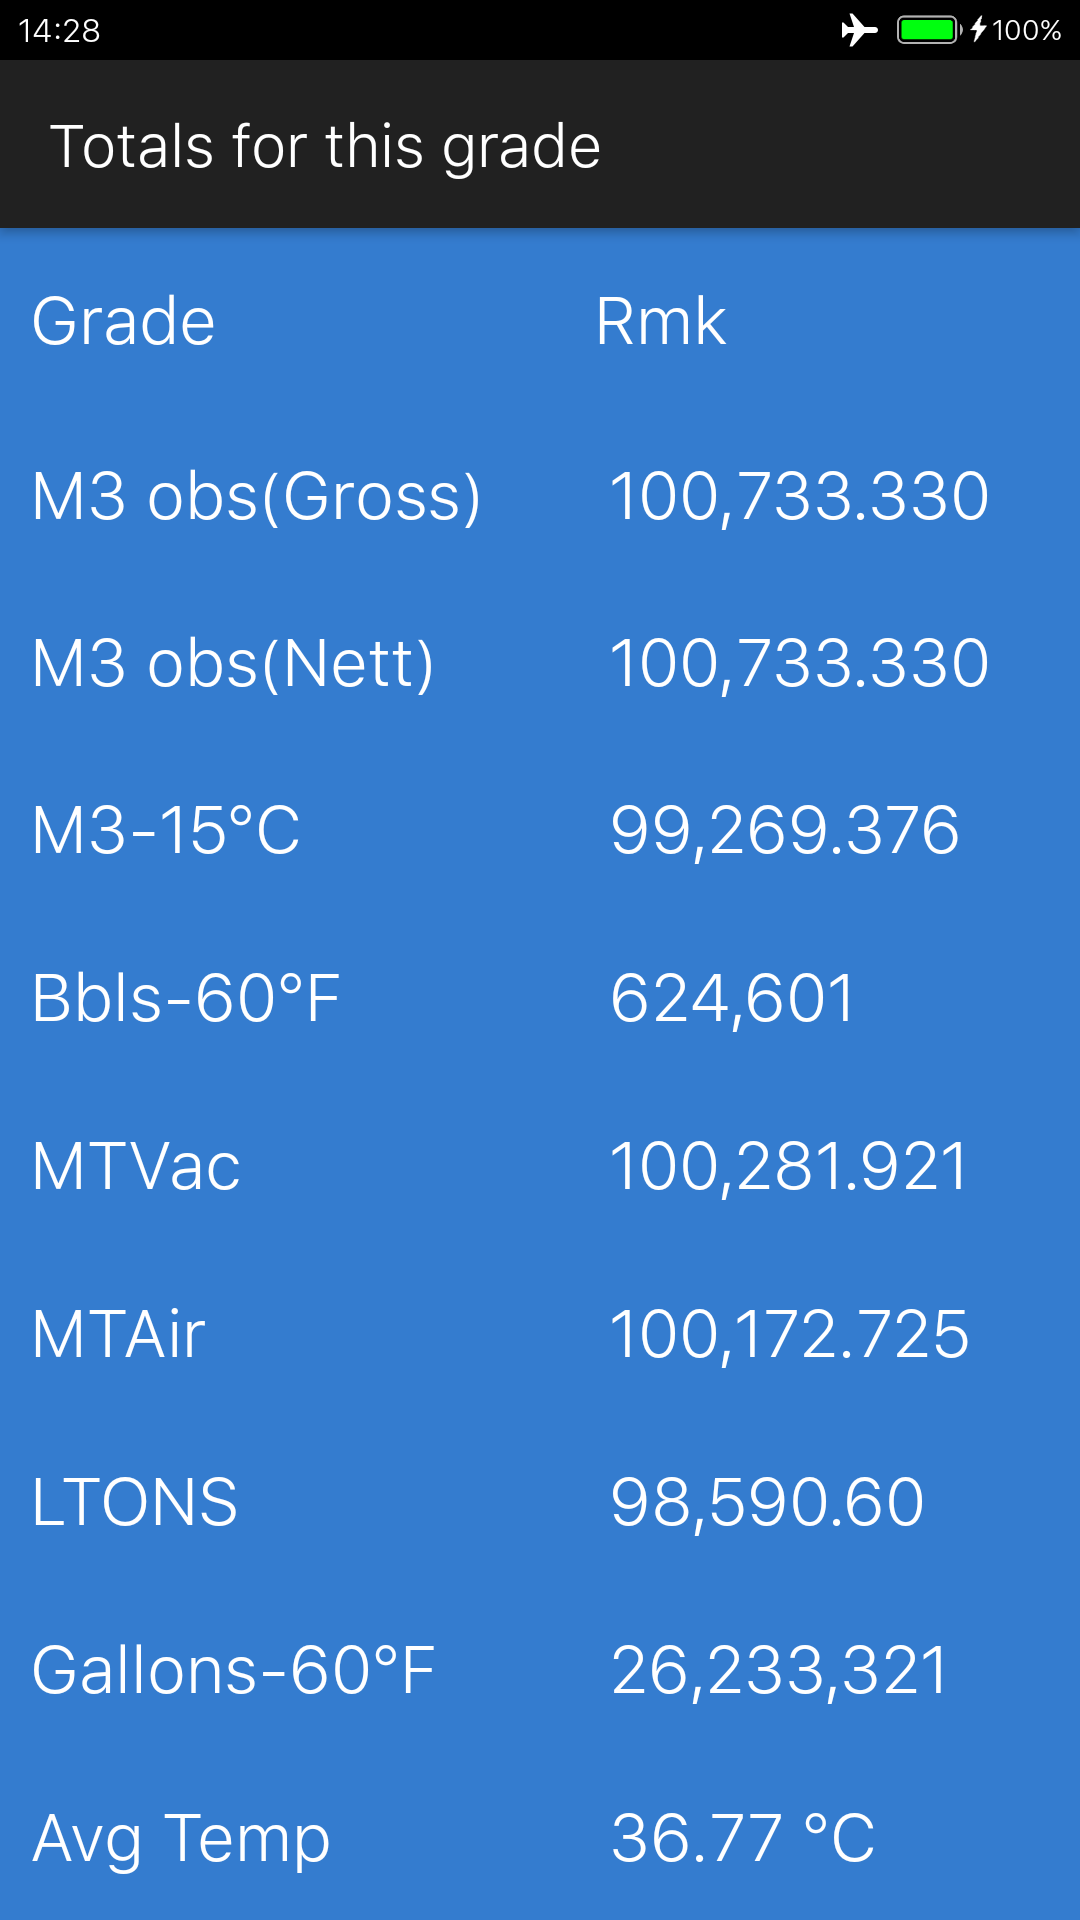
Select grade or totals

‘Before’ report selected
‘After’ report selected
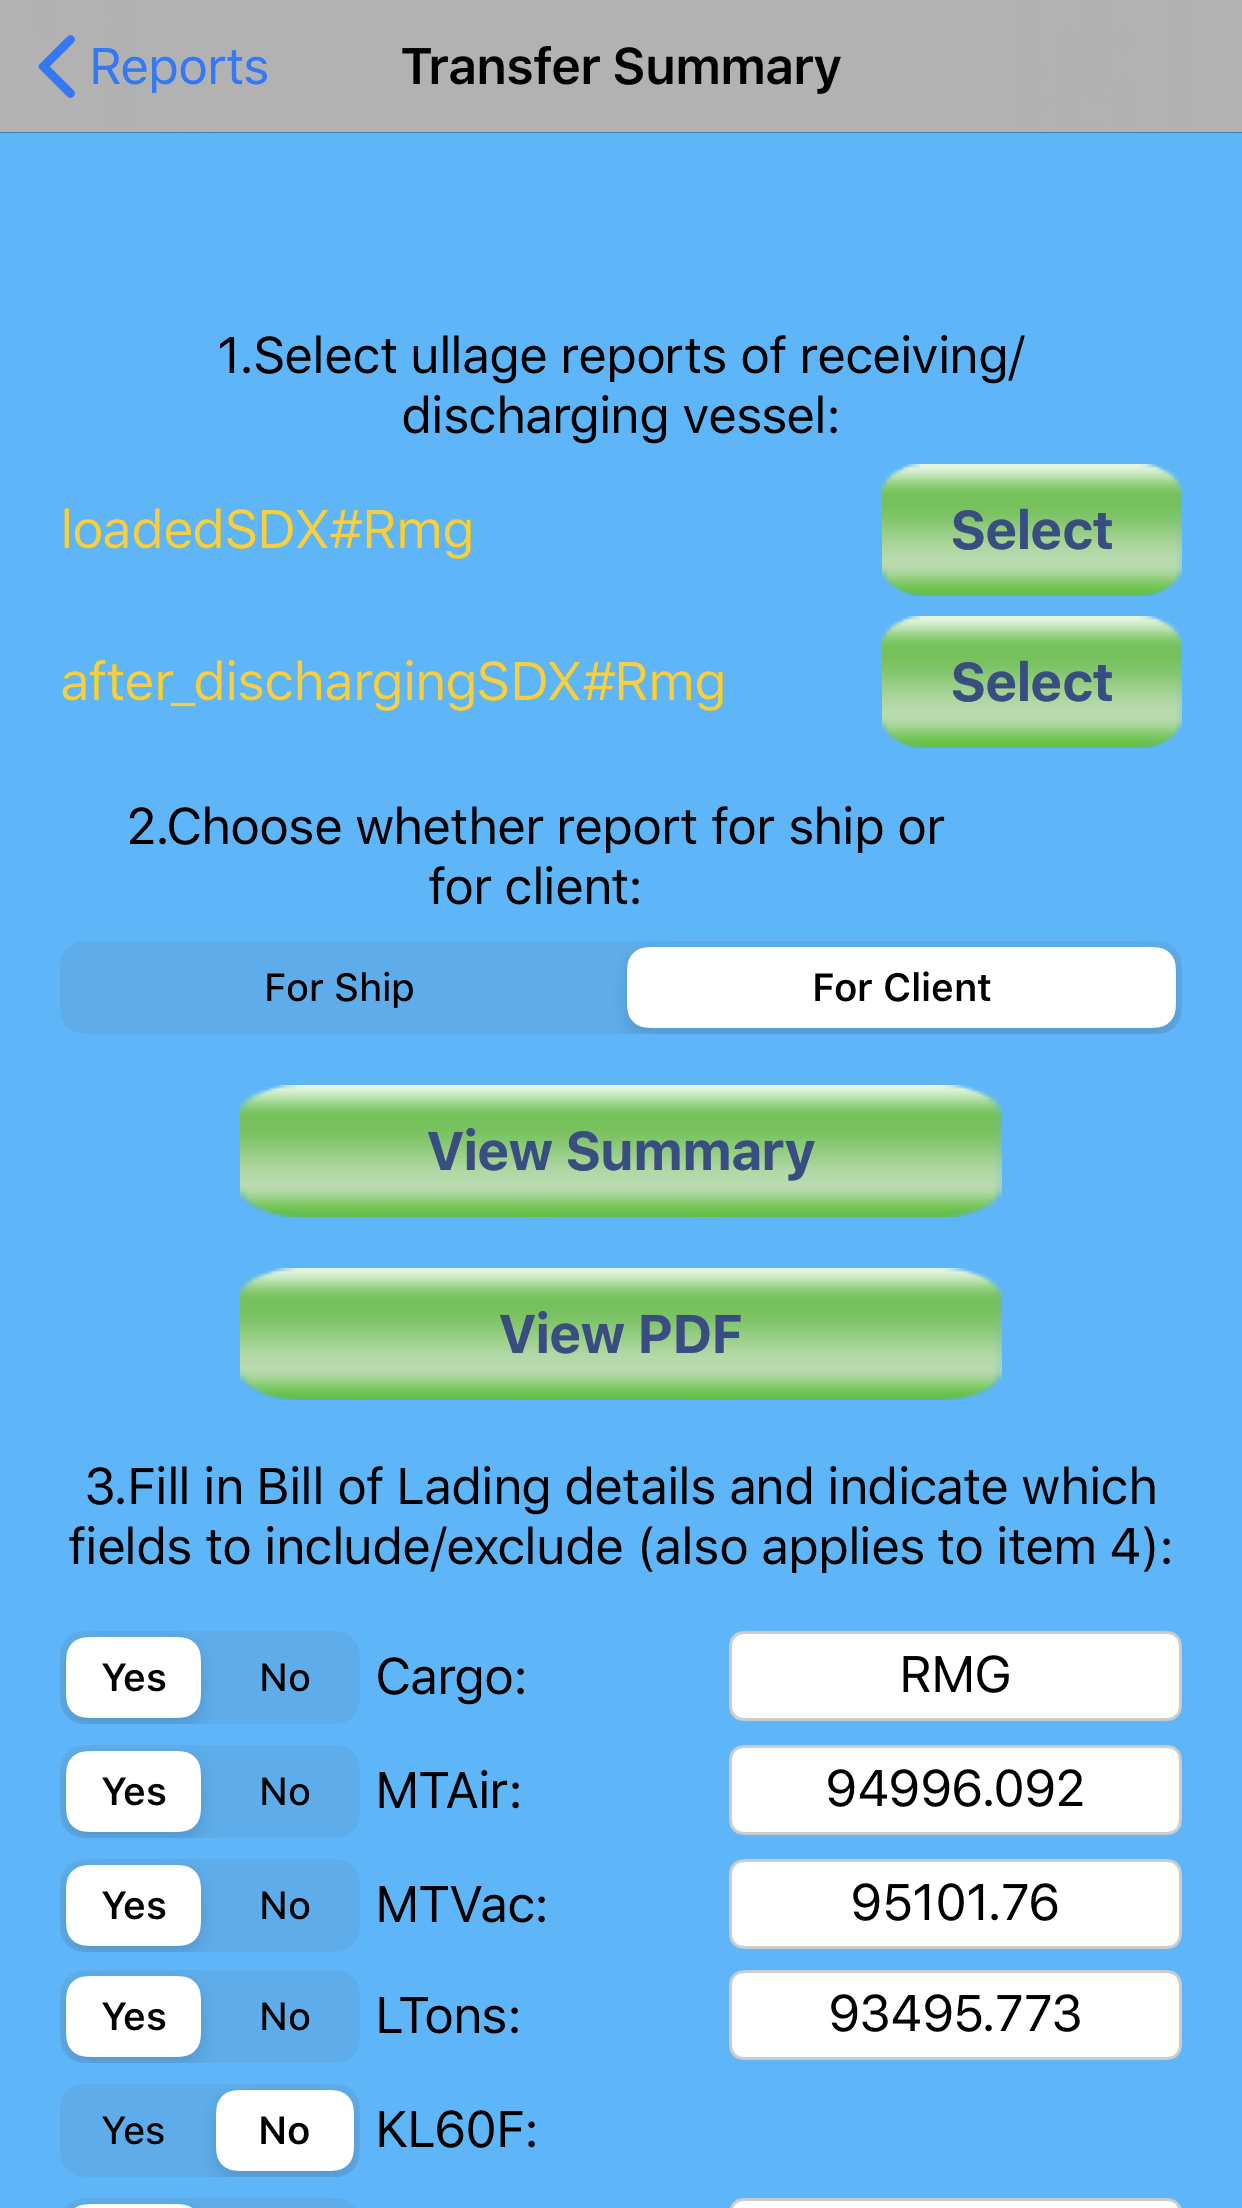
As you can see in the picture above, our two earlier generated ullage reports have been selected: ‘loaded’ and ‘after discharging’, and for each report the grade ‘Rmg’ has been selected. We could also have selected ‘Totals’ in this case since each report only contains one grade, but if the vessel were loading or discharging multiple grades then we would definitely have to select here the grade that we want to be calculated only.
Below the ‘For Ship’ switch there are two buttons:
– View Summary: when pressed, this will show the total quantity loaded or discharged, in a new window:

View Summary
– View Pdf: when pressed, this will generate the actual pdf (or jpg) file, and allow you to send by email.
Now let’s have a look at the full view of the transfer report editor when ‘For Client’ is selected:

Item 3 under the buttons ‘View Pdf’ and ‘View Summary’ allows you to enter the Bill of Lading details. It also lets you select which units will be printed in the transfer summary report, using the switches ‘Yes’/’No’ in front of each unit.
There are switches for mtons vac/air, ltons, M³ at 15°C and M³ at 60°F, Bbls and Gallons. In case the vessel is doing an STS transfer, there are two fields for applying VEF.
Item 4 under these switches lets you select whether the cargo operation is at a shore terminal or doing ship to ship. If you select ‘Terminal’, the fields for VEF are set to hidden.
Under the ‘Terminal/Ship to Ship’ switch you can enter details of the quantity loaded or discharged from / to terminal or other vessel:

As you can see we have entered here quantities both for Bill of Lading and for quantity received by the daughter vessel Alfa Centaur. Whether we use M³ at 15°C or M³ at 60°F depends on whether we have selected SI Metric or Imperial in general settings: in Europe you generally use SI Metric and consequently M³ at 15°C; in the US or other countries where Imperial units are adopted you use M³ at 60°F. The two switches for M³ at 15°C and 60°F cancel each other out: if you select ‘Yes’ for M³ at 15°C, the switch for M³ at 60°F is automatically set to ‘No’ and vice versa.
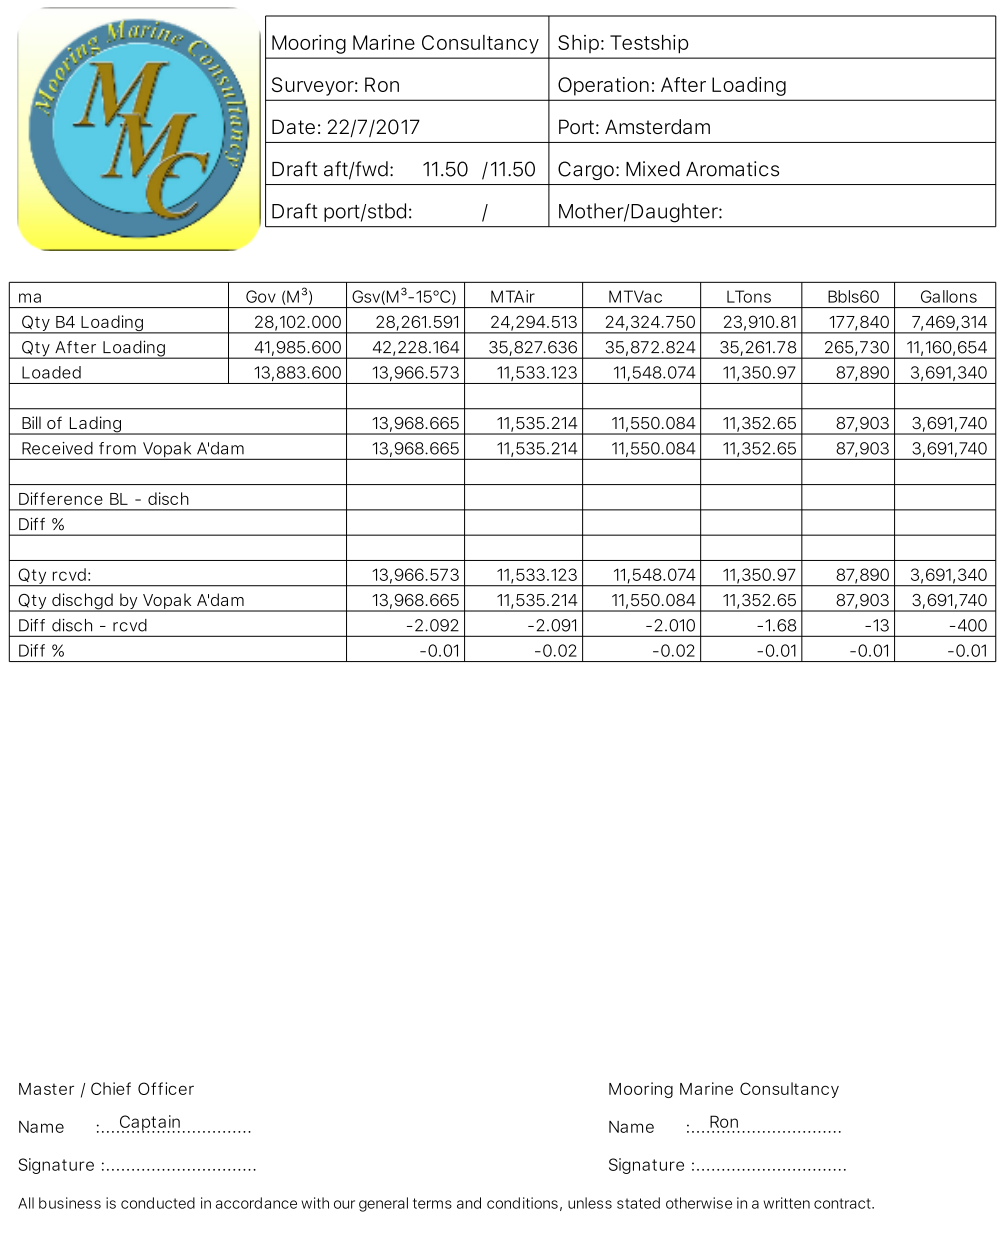
After filling in the required quantities and other details we can now press ‘View Pdf’ and the pdf report will be generated, as shown below. The report has been printed using SI Metric units in general settings.
If you wanted to print the report in Imperial units, then you should also select M³ at 60°F for the GSV Bbls under item 3 and item 4 and instead of M³ at 15°C, otherwise GSV quantities will not match.
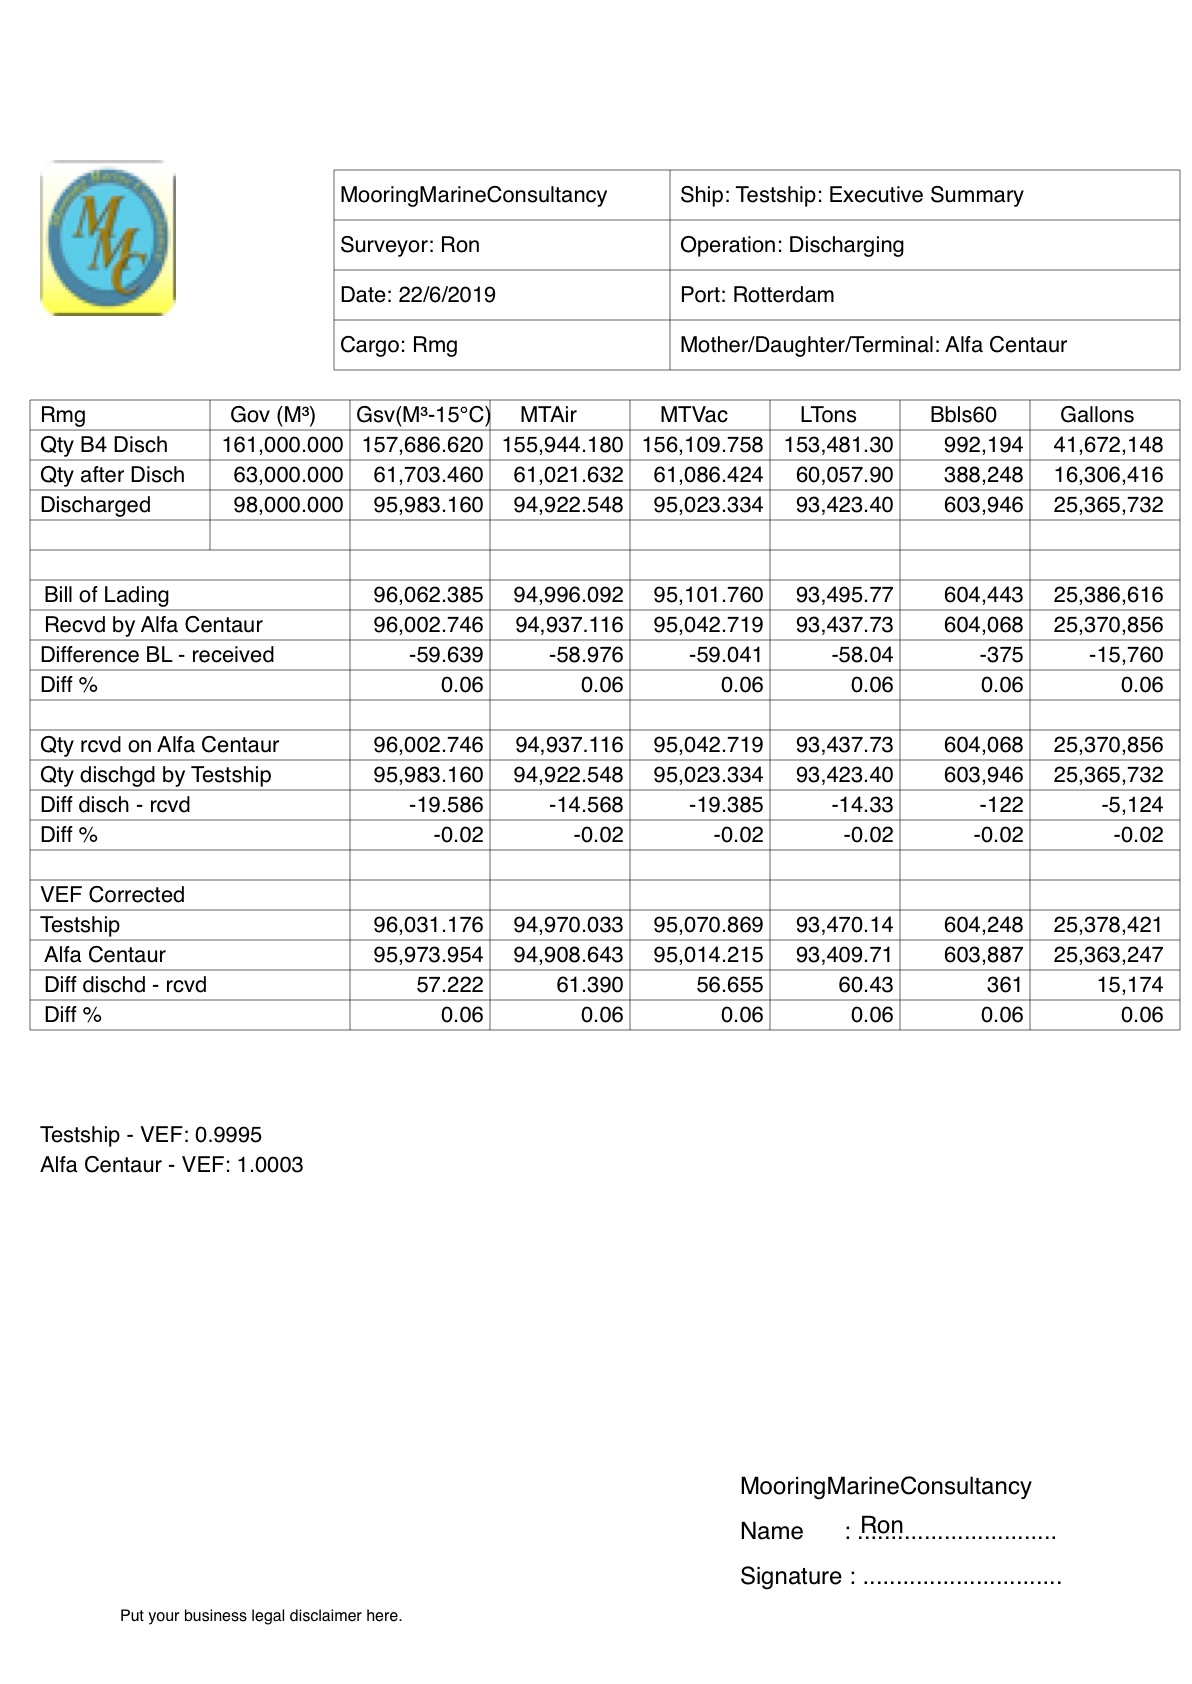
Executive Summary report
Just like the other reports, once we generate the pdf (and jpg file, if we have set ‘Autosave pdf to photos’ on), we get the option to send the report by email.
In the mean time, for those who are interested in Cargo Surveyor for iOS: the app can be downloaded here:

If you have any queries, suggestions, comments, criticism about the app or this blog post, please let us know! We always do our best to accommodate any requests for additions/modifications to our apps if they improve the value!